BOXBROWNIE.COM LISTING VISUAL MARKETING ANALYSIS
PREFACE
When BoxBrownie.com arrived in the USA in mid-2017, we came in cold. There was no preconception as to how the USA property market operated and what it was like. Having been a successful Real Estate Agent in Australia since 1999, I confess I had never been to the USA until this point.
There was an assumption (which one could blame on American TV) that everything in the USA was likely to be better and a standard higher than the rest of the world. As a team of three (Brad, Mel, and myself) we came across the Pacific Ocean assuming that there would be a lot of hard work to crack into the property industry in a meaningful way.
Over the next 4 years, the property industry in the USA certainly did not disappoint any of the BoxBrownie.com team members. We found that hard work and toil certainly were recognised and paid off. Indeed, from day one we were embraced by nearly all areas of the industry, and writing this toward the end of an 18-month COVID affected hiatus, as a company we are yearning to rekindle the love affair that is between BoxBrownie.com and the USA agents. Indeed, we owe a debt of gratitude to the property industry in general, perhaps one that we will never be able to account for.
One truly great mystery we here at BoxBrownie.com have never been able to fully understand is the true state of visual marketing for a listing across North America. Even, to begin with, the fact that the two words “Property Marketing” used in America rarely mean the same as what they mean globally is astounding in itself.
PROPERTY MARKETING
In my first year in the USA, I attended a REBAR Camp. For those of you unfamiliar, these are forums whereby the content is dictated by the attendees on the day of the event. The organisers form a panel on that idea/discussion. Generally, there is a board where topics can be put forward and “up-voted” with the popular topics forming the content. I was delighted to see the topic “Property Marketing” being one of the more popular topics and made a beeline for that room. The conversation was moderated by a bloke by the name of Jay Thompson. And whilst the session went according to play for the Americans, it was the first time I became aware that the words “property marketing” (to the average agent) meant more about the marketing of oneself or a brand than any inference toward the visual marketing for the property they were listing to sell. In any foreign country, “property marketing” means how one would market a home or dwelling or land that they are listing to a purchaser or lessor.
Back to “visual marketing for the listing” which is the new term we have for what it is we do at BoxBrownie.com (terminology credit to Travis Saxton, T360), we know that there are amazing listing agents who visually market a listing to some of the highest standards in the world across America. But across the board, we have been incredibly sceptical that the standard of visual marketing for the listing in the USA is where it should sit globally.
We are avid travellers and have sponsored and attended many conferences around the USA. Anecdotally, in conversations, at booths, as a speaker from the stage, and more recently in webinars and online training, it would be fair to say that most American agents believe their standards of property marketing to be top-notch. For example, there are very few who will admit to taking pictures with their smartphones despite what online portals and aggregators are telling us visually.
Moreover, the issue for us is that it is hard to make a point to any person to improve their marketing if they truly believe that where they sit on the ladder is at the pinnacle.
EXISTING RESEARCH
I have heard a lot of criticism of the National Association of Realtors over the past 5 years in the USA. Of the many countries I have travelled to, the NAR would have to be the organisation providing the greatest benefit to its members that I have ever seen.
One of the most under-rated pieces of information the NAR dutifully release annually is the Home Buyers and Sellers Generational Trends report.
.png) I cannot speak highly enough of the value of the data released in this report and I personally wished my home country had equivalent data available to agents in order to assist us in sculpting business direction. Staggeringly, I would estimate the members who would know about this report and understand its value to be in the minority. Since 2013, annually this report has shone a light on the website features a purchaser would want to see in their efforts to purchase a property (page 59).
I cannot speak highly enough of the value of the data released in this report and I personally wished my home country had equivalent data available to agents in order to assist us in sculpting business direction. Staggeringly, I would estimate the members who would know about this report and understand its value to be in the minority. Since 2013, annually this report has shone a light on the website features a purchaser would want to see in their efforts to purchase a property (page 59).
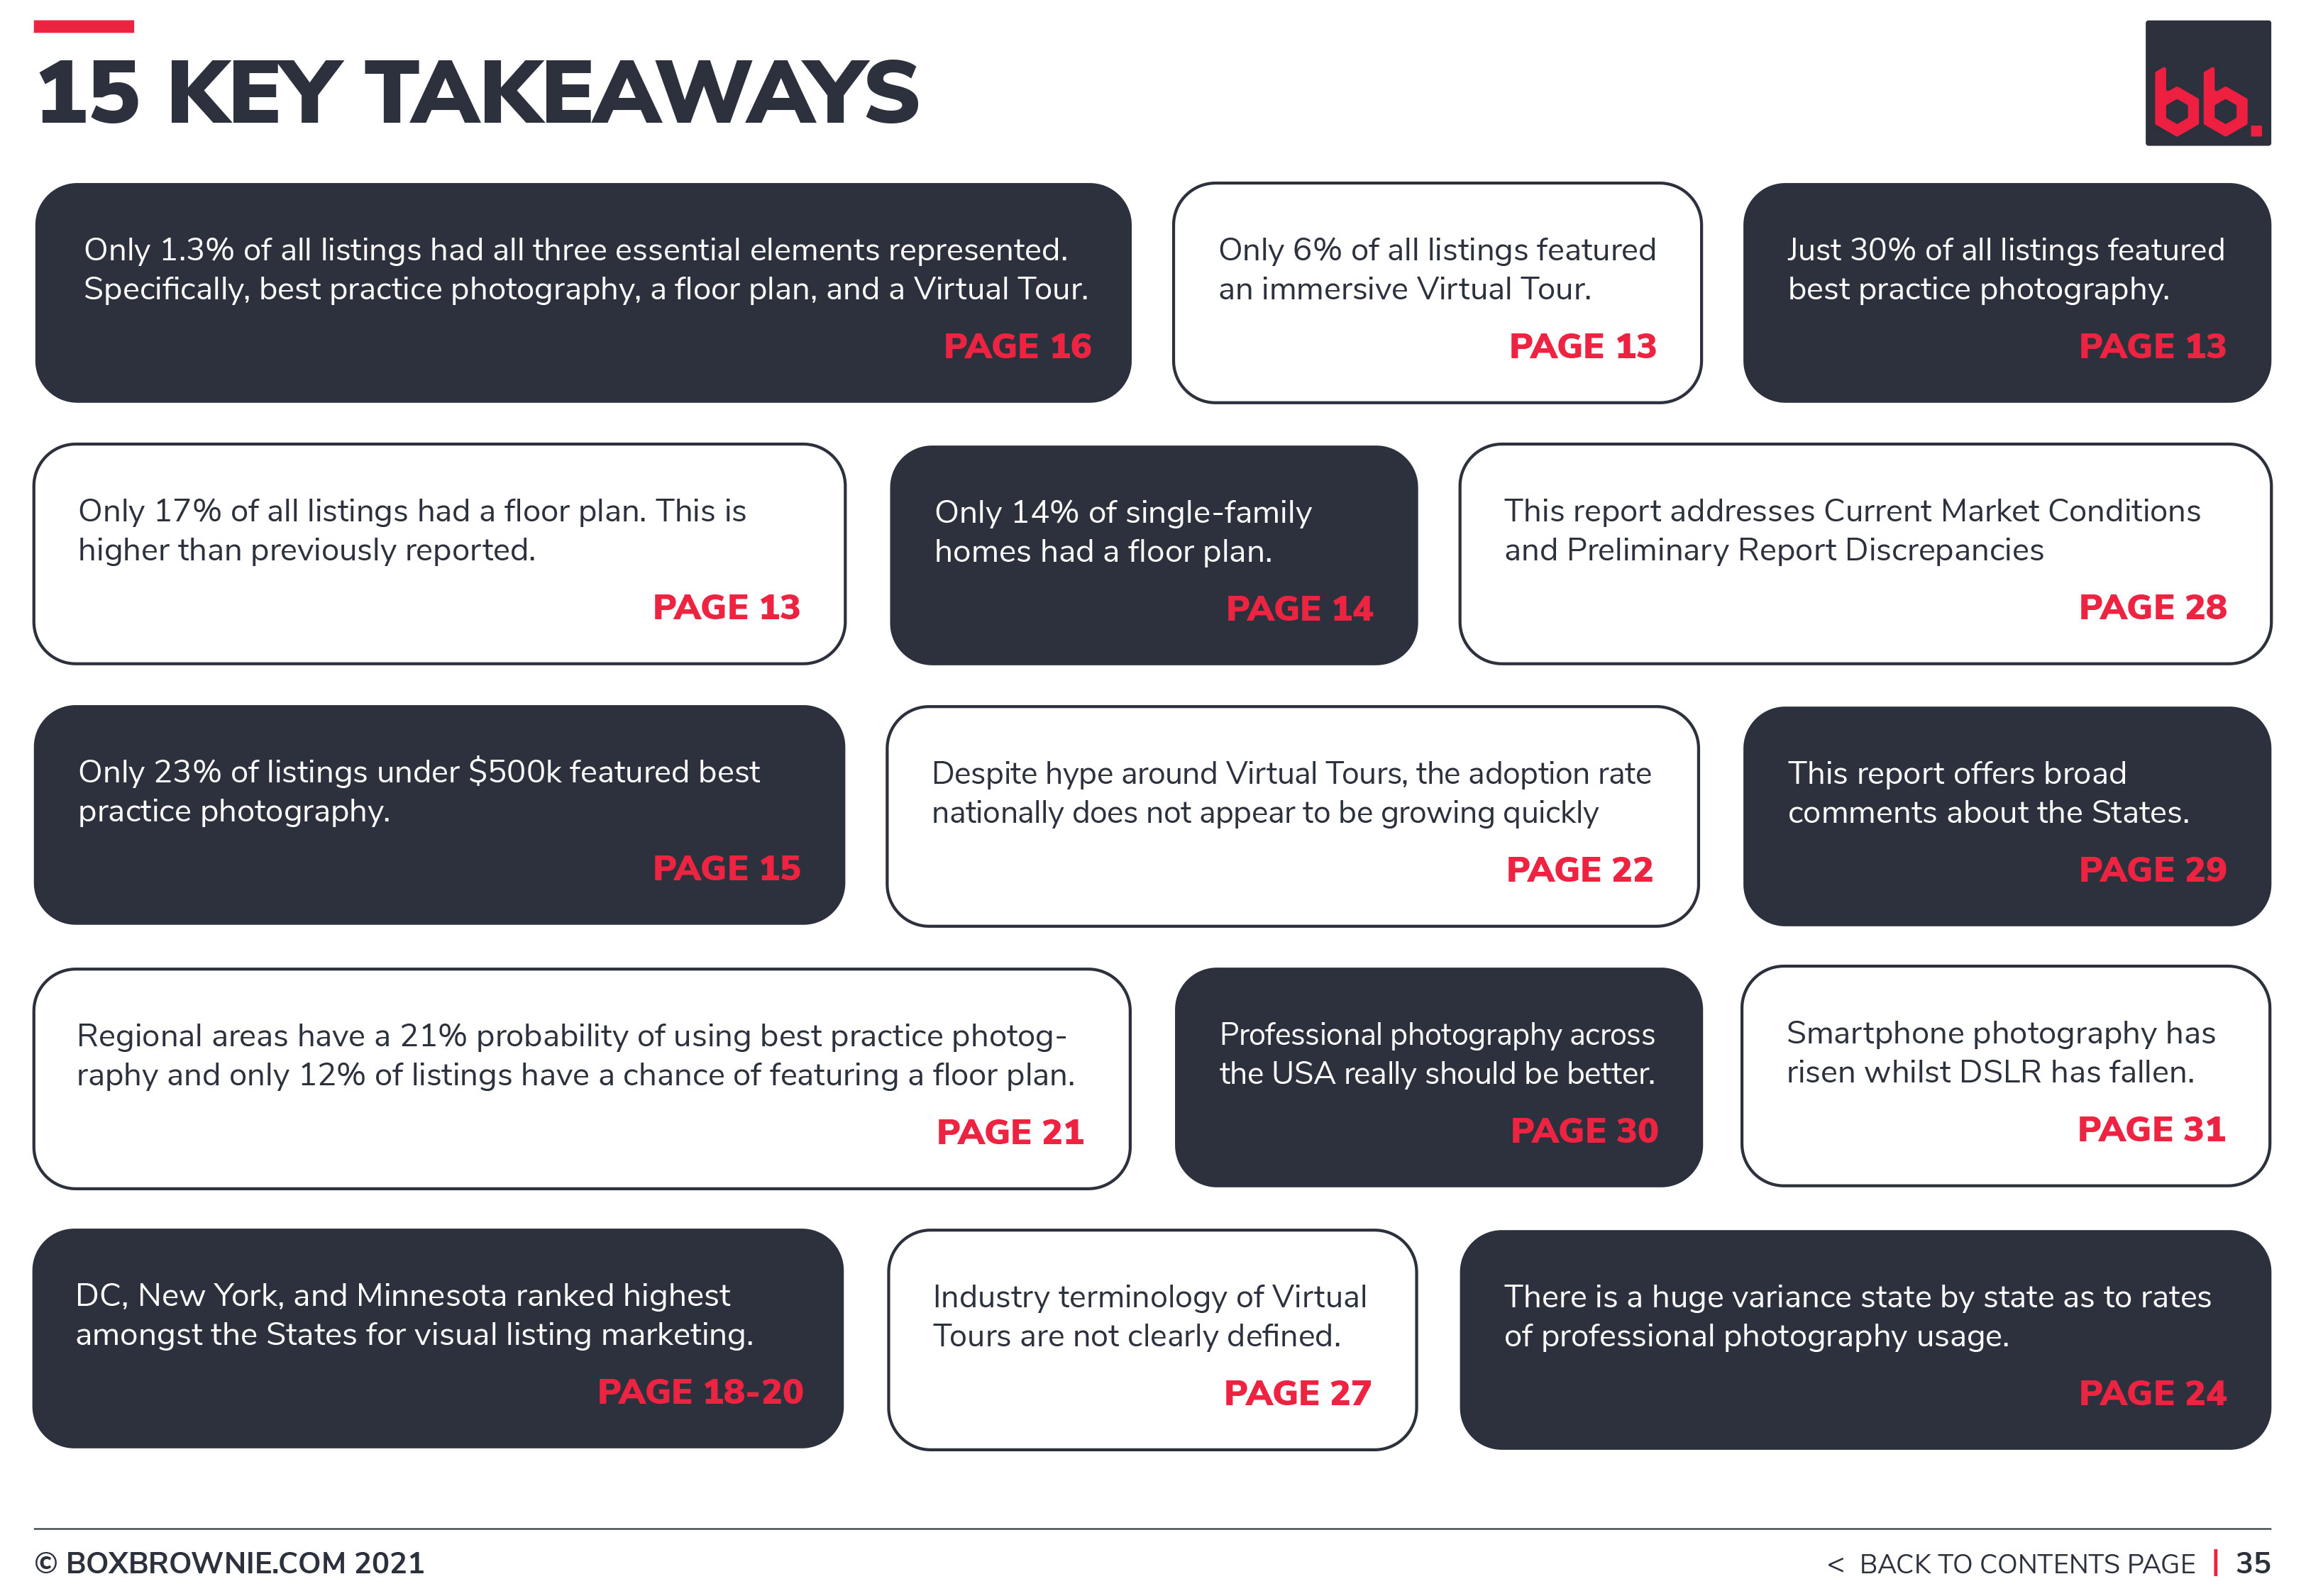
Even at the quickest glance, the report tells us a few things:
- 89% of all purchasers regardless of age wish to see Photos of a listing
- 67% of all purchasers regardless of age wish to see Floor Plans of a listing
- 58% of all purchasers regardless of age wish to see a Virtual Tour of a listing
These three figures are slightly higher than they have been over the past years, which I could argue might be the influence of being in a year of lockdowns and more difficult access to properties for inspection. However, none of them are out of order with the previous 5 years and more worth of data this annual survey has collected.
If you look at the entire list there are some categories that I have always found humorous, for example, “Real Estate Agent Contact Information”. I would assume for this to be on the list, at number 4, there is conceivably some Agents not handing out their information to purchasers? Where I come from that person is unlikely to be an agent for very long.
A MARKETING PLAN
Over a period of time, I took the NAR report and paraphrased page 59 to formulate a plan for agents to follow in order to maintain consistency or marketing/brand and to sell a property for more, faster.
In order of priority, relating to what the purchaser wishes to see, it is our belief at BoxBrownie.com that “best practice” agents have a marketing plan that looks like this:
- Good imagery
- Copy with all essential detail
- A floor plan
- 360°/Virtual Tour
- Video footage
The research conducted investigates only three of the above aspects of visual marketing for a listing; Good Imagery, Floor Plans, and 360°/Virtual Tours.
This research report is not to point people to BoxBrownie.com’s services. However, through the services we offer, I believe we are best positioned to shine a light on these practices. And whilst it is true that we have a solution for some of these issues, other companies do as well. Our message to the agent, broker, franchise, association, and MLSs is that marketing matters· and our challenge to you is to improve your property marketing to better serve the purchasers and sellers within the industry you operate.
So BoxBrownie.com, as a company, and I, as a bullish, inquisitive, now non-practising listing agent (genuinely interested in the USA property industry and equally in love with the fabric and people who make the industry be who it is) are excited to offer this first research report to the American property industry. It is a way of saying thank-you for the way you have accepted this Australian start-up (now scale-up) and the love and support you have shown us over the past 4 years.
METHODOLOGY
Selecting Portals
One of the difficult things to do as an “outsider”, or someone not attempting to purchase property in the USA, is to get a well-balanced view of listings across the USA through Multiple Listing Services. On many occasions when we tried, we were confronted with capture fields wanting our email address and phone number. Equally, we found quite a few to be very difficult to navigate. Some wanting us to identify search parameters to locate property. These tools are excellent for a purchaser but problematic for researchers who want a balanced view of listings across the USA.
Equally, we had requested listing data from MLSs but only had success with one answering our calls for assistance. A big thank-you to Bright MLS for your assistance in this area.
This led us to the two main portals representing USA listings Realtor.com and Zillow.com.
In the past we had run smaller tests using the Realtor.com platform, only to encounter criticism from Zillow users who believed the listings on one portal to be inherently different in visual marketing quality than the other.
We decided the best approach was to analyse both.
Using a random zip code generator, we began analysing 50 listings in each zip code provided by the generator. To be clear, 50 listings of one zip code on Realtor.com and then 50 of another zip code on Zillow.com, alternating through the portals. We did this to avoid potentially corrupting the listings we had harvested on one portal reflecting the listings we had harvested on the other.
Putting both portals in “List” view, we would select each listing and conduct the following research:
- What is the property price?
- Has the agent/seller engaged a professional photographer?
- Is the output of the professional photographer “best practice”?
- Does the listing contain a floor plan or a site plan or both?
- Does the listing have a Virtual Tour/360° tour?
a. Click through to the tour and note whether the tour is immersive or otherwise. - Is the listing a single-family home, multi-family dwelling or block of land?
- Is the listing of an established property or of a property that is being sold either prior to or during construction/development?
- The URL to the listing.
Categories
Property Price:
The property price was recorded to the thousand. For example, if the property was $1,500,000.00, we would record 1,500 with the understanding that this property was $1.5 million. We would disregard any hundred pricing, meaning that if the property price was $456,789.00 we would record 456 and discard the seven-hundred and eighty-nine dollar amount.
Professional Photographer
On an earlier trial of this research, we ran a much smaller research batch, only identifying “best practice” photography. After looking at the earlier research we found ourselves wanting to understand whether we thought the agent had attempted to engage a professional photographer.
We looked at various methodologies in trying to definitively identify whether a professional photographer had been used or not. There is not a 100% accurate way.
Here are the criteria we assessed:
- The photography is not of a low standard.
- The photography has not been taken using a smartphone.
- The photography has been edited.
- The angles used for the photography are indicative of professional photography.
- There have been techniques employed in the shooting of the property that would indicate the photographer is a professional.
- There were watermarks or links associated with the listing that would indicate a professional had taken the photos.
Best Practice Photography
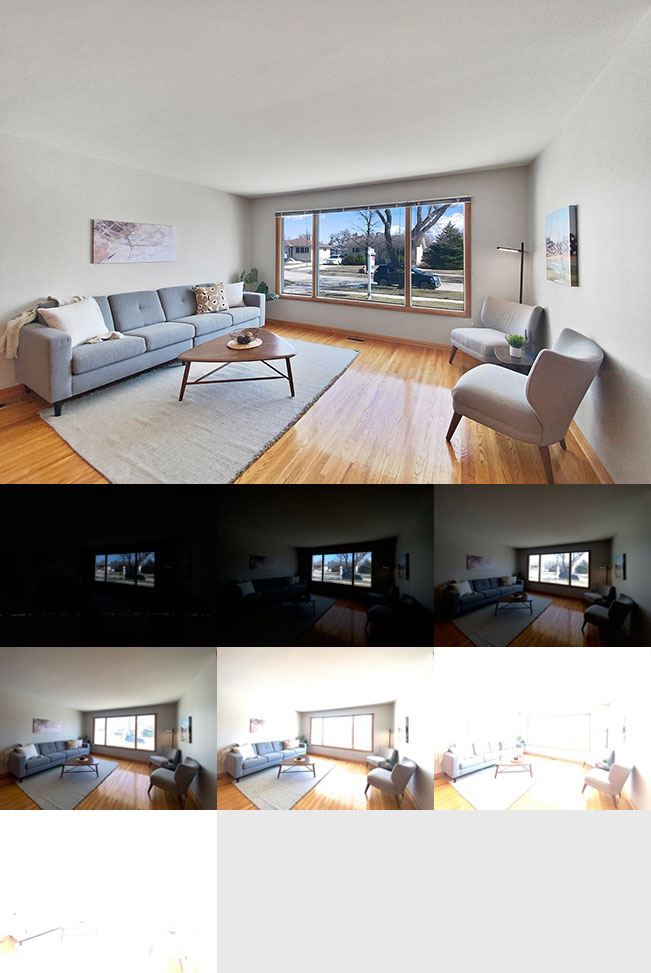
There is only one globally recognised technique of photographing a property to best represent it for sale. It is a bracketing/HDR method. This method can be combined with other shooting techniques, but the common denominator is known as bracketed shooting. If a bracketing technique has not been employed the photo editor will find it nearly impossible to return the image to what the eye sees at a property.
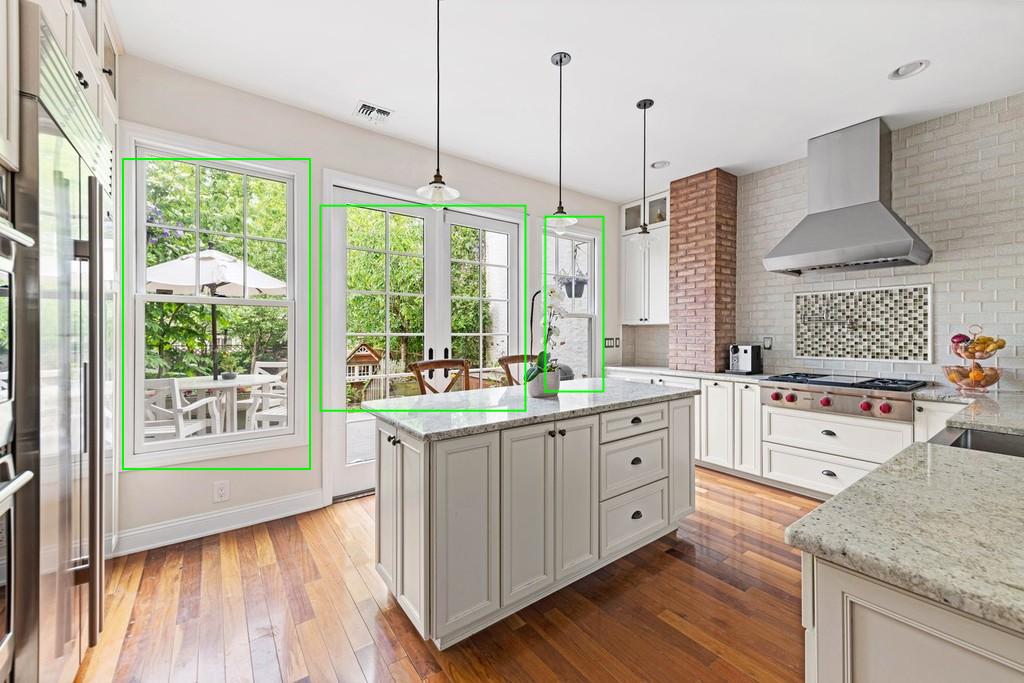
It is easy to spot the difference between a photo output where bracketing has been used as opposed to when it hasn’t. On each listing, we would navigate to an image where there was an interior image featuring exterior window detail. If the window detail was as clear as the eye would see if a person attended the property, the researcher would mark that listing as having utilised a bracketing technique (see image below).
Importantly, we set a low bar for the identification of bracketed shooting. Below is an example of one we would call “in-between”. The image is not up to best-practice standards, but because it is difficult to know as to whether the issue is with the photo editor or the photographer and the brackets they chose to shoot at, we would give this kind of output the “benefit of the doubt”.
Below is an example of an image where bracketing has not been employed. This is a good example of an image taken by a professional and edited, but not employing the bracketing technique.
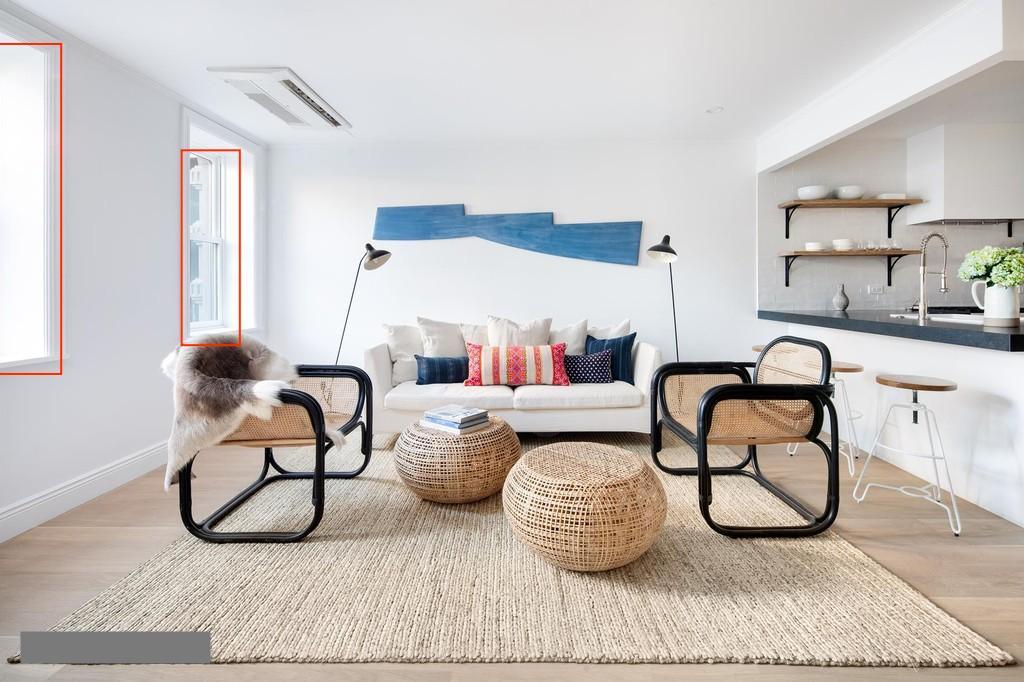
Clearly visible are the interiors, but there are no known cameras that can deal with multiple light sources in this fashion.
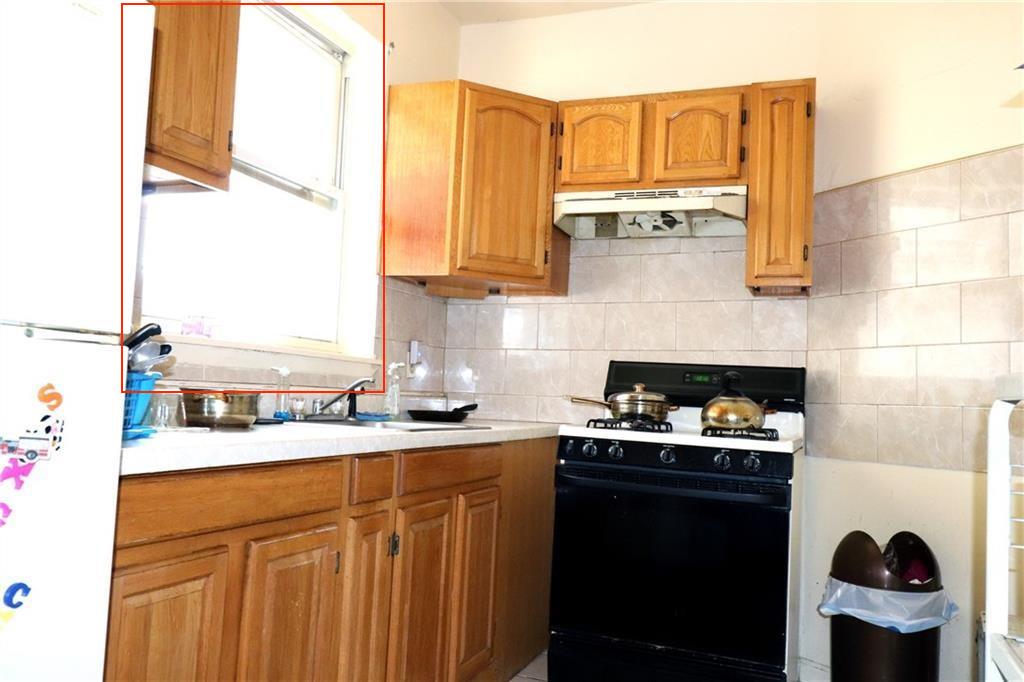
The image below is unlikely to be taken by a professional.
Floor plan
This was simply a question of whether one was present within the listing. There was no analysis of the quality, style, or accuracy of the plan.
We have used the term floor plan, but we also considered a site plan for land and floor and site plan combinations for house and land sales.
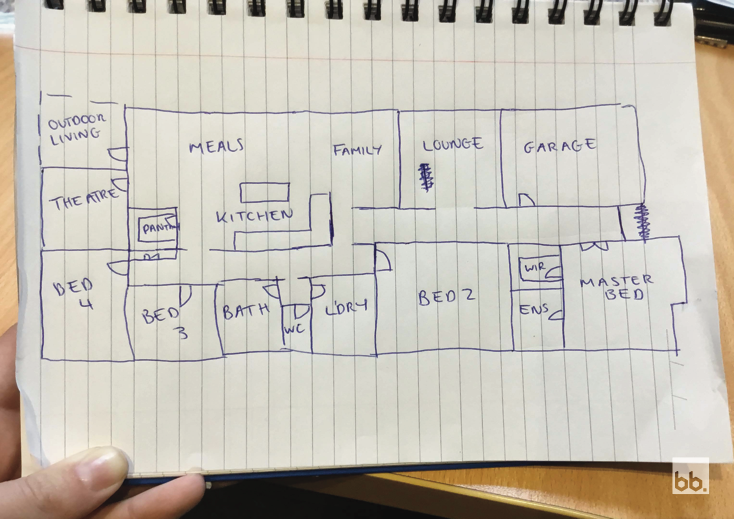
The below was considered to be acceptable:
Virtual Tour / 360° Tour
On both portals, this function appears as an icon or clickable button that activates a link.
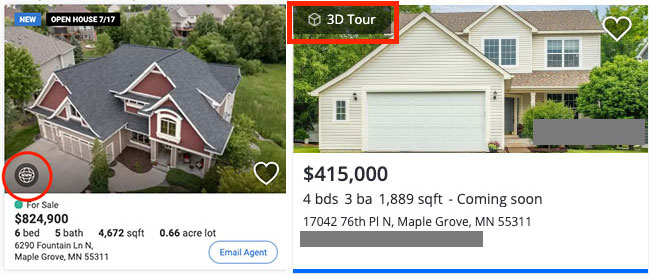
- There was a wide array of destinations that link would take one to. Those destinations included:
- A photographic slideshow of the pictures for the listing through a third-party provider.
- A single property website, or a website specifically for that listing.
- A video carriage platform (like YouTube or Vimeo).
- Broken links.
- A 360° or immersive tour provider.
- Other.
Whilst we initially set out to discover whether a listing had a 360°/Virtual Tour, the earlier test run had identified that the presence of the above buttons were only indicators of the presence of a link.
Upon realising this we divided this section into two parts. Did the listing identify itself as having a 360° Virtual Tour?
If the answer to this was “yes”, then did the link take the viewer to a 360° or immersive tour, or something else?
Property Type
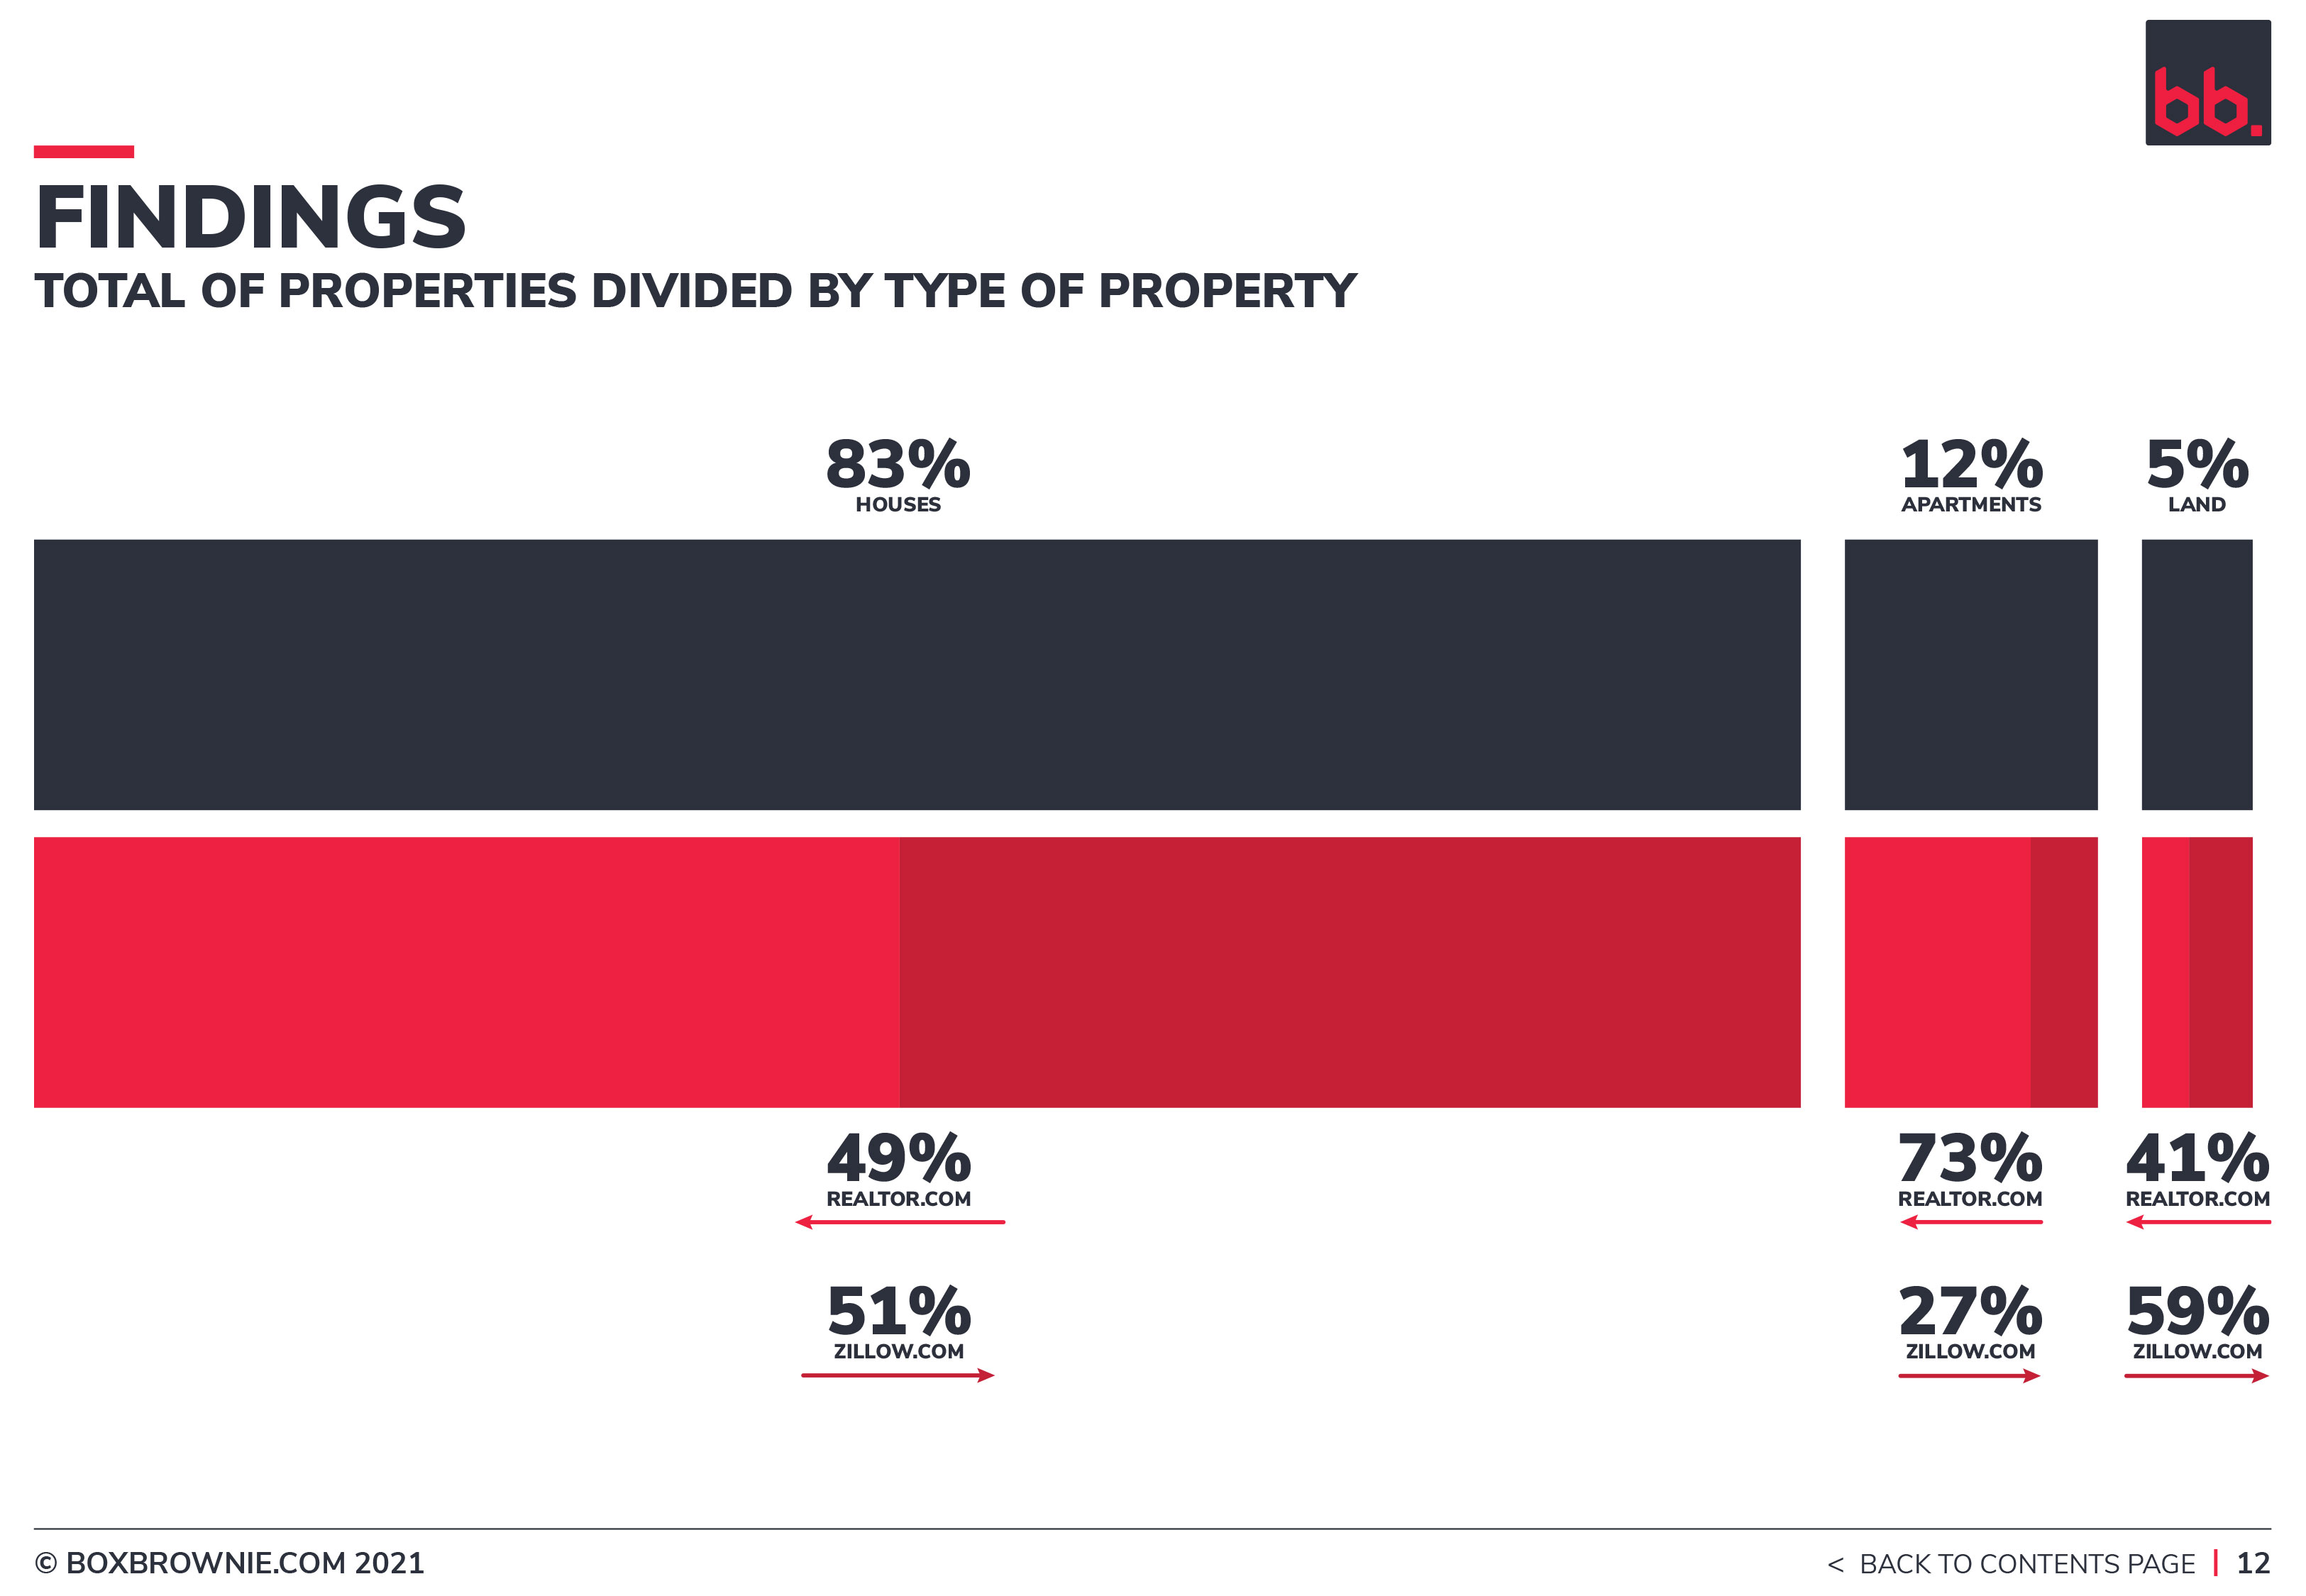
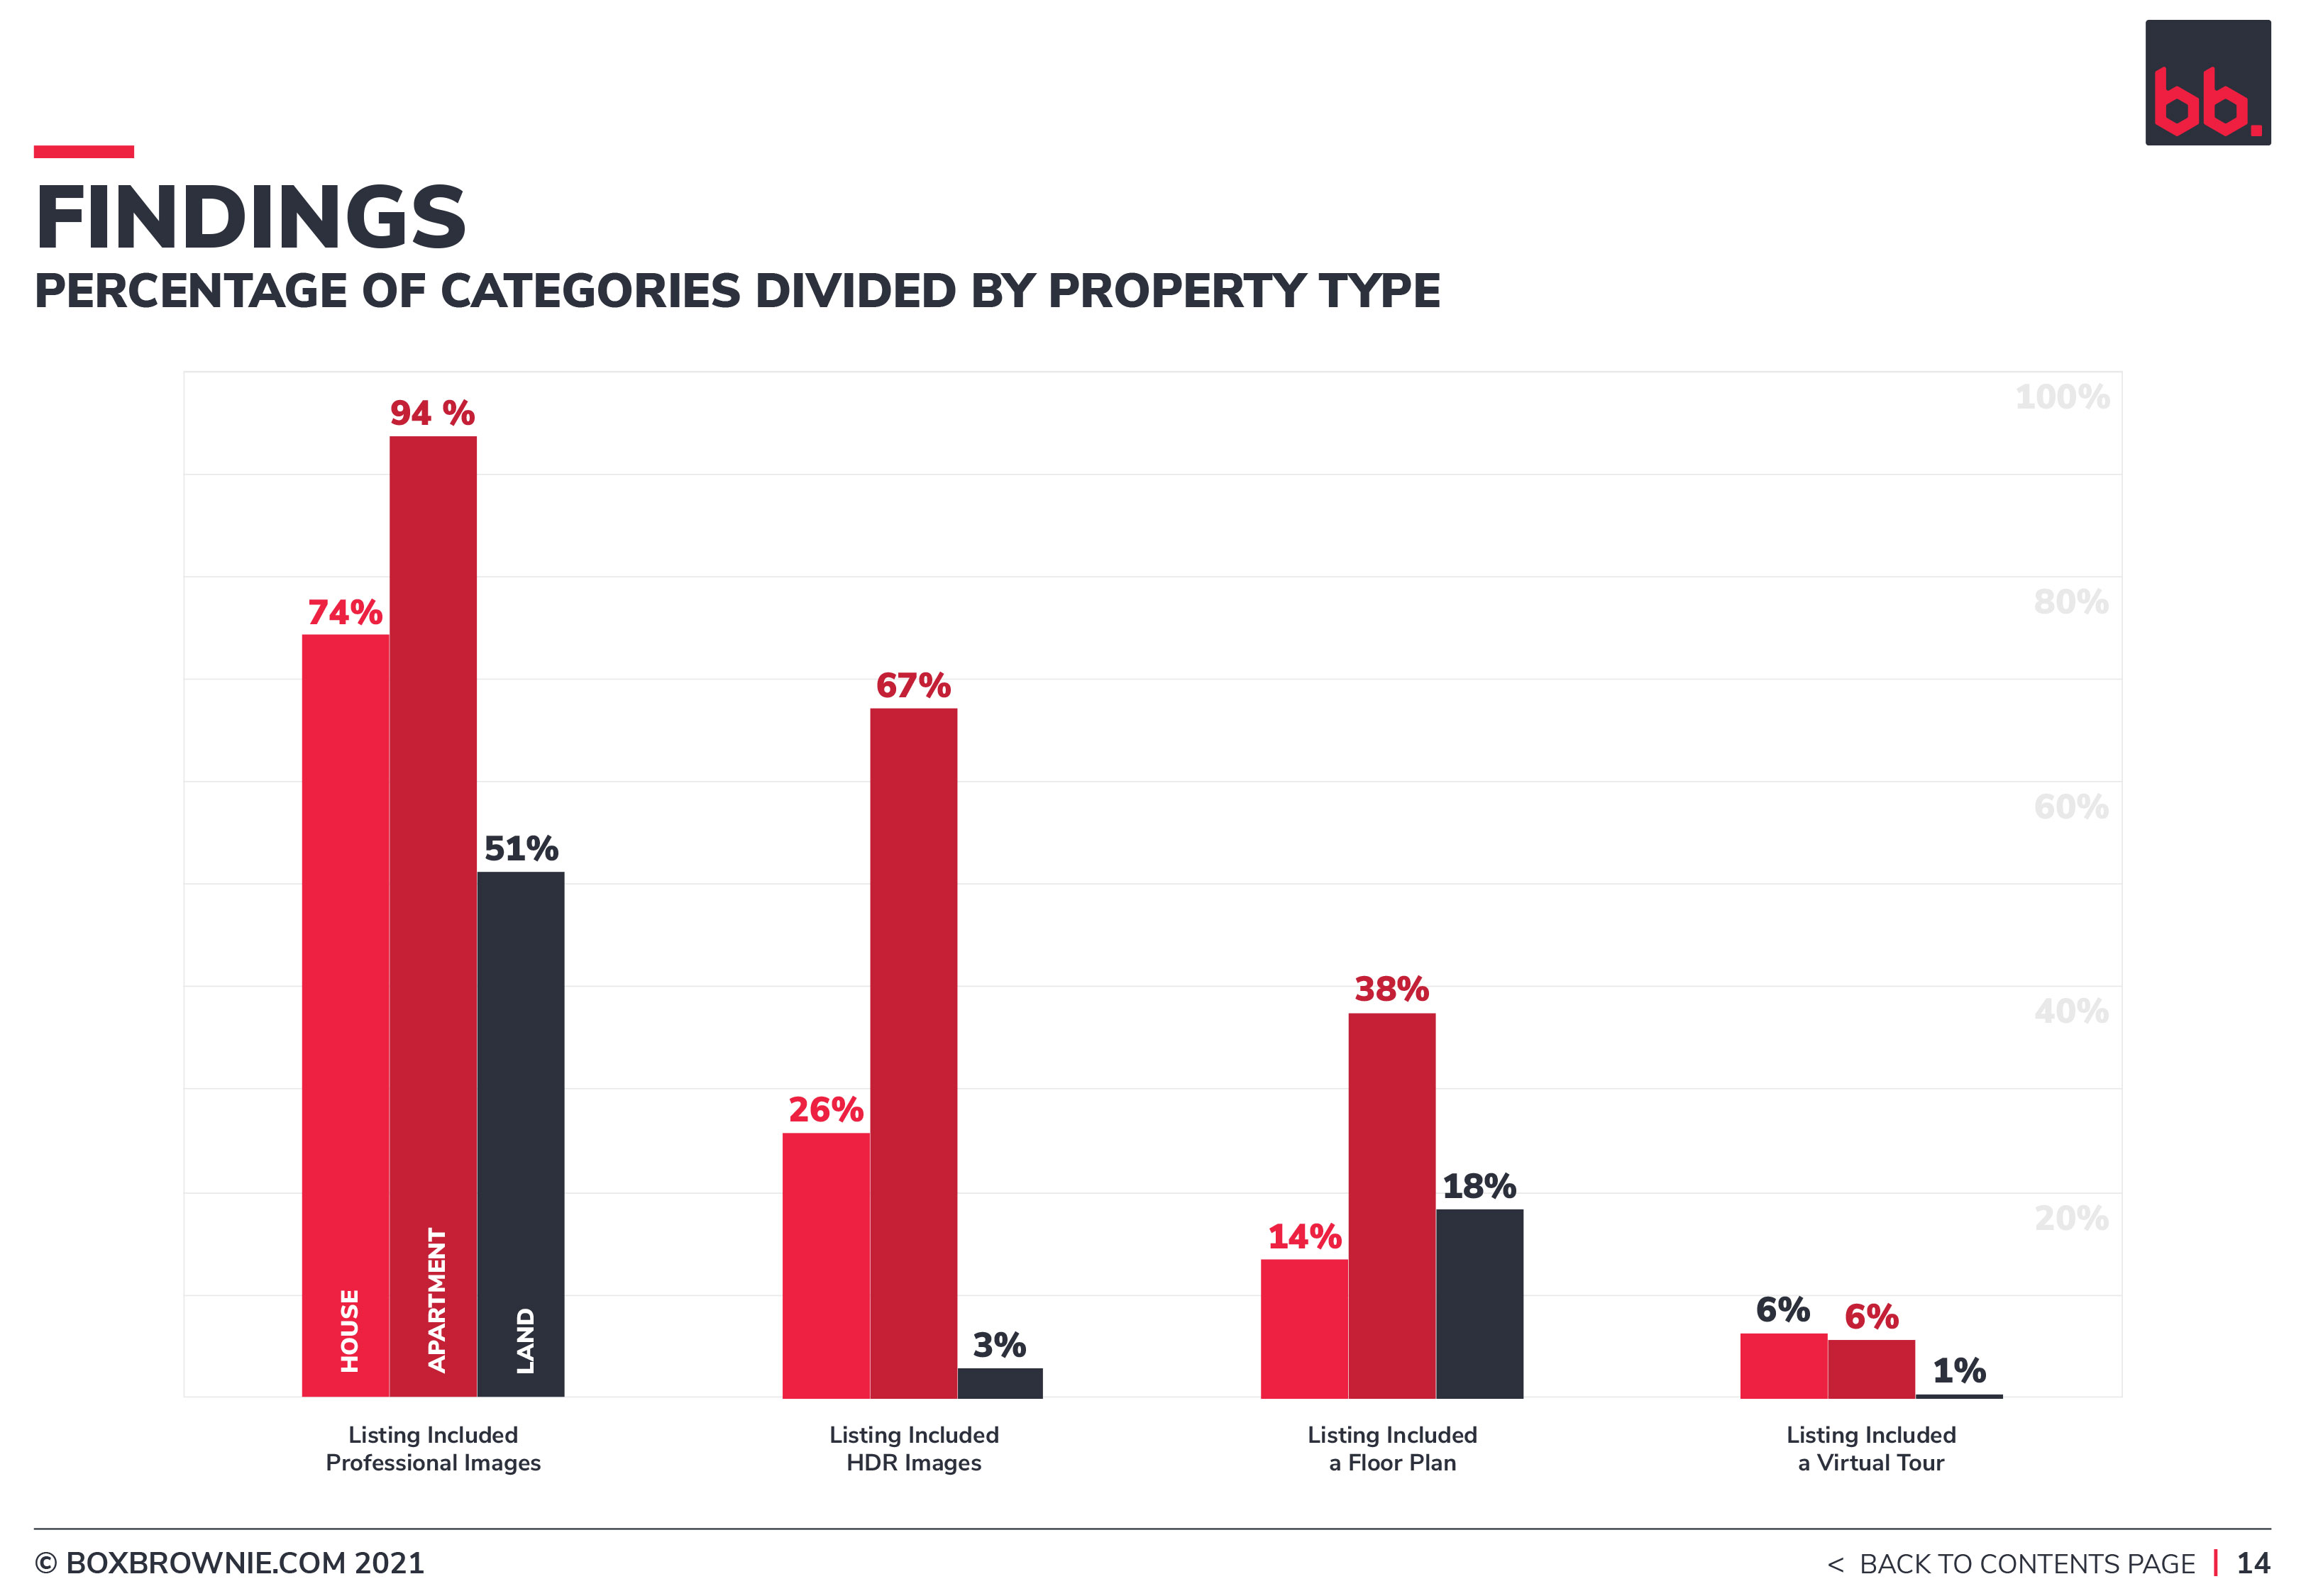
From the test research runs, we found huge discrepancies between the marketing of different property types. For example, most land listings would identify as having a site plan attached, and surprisingly a lot of multi-family listings would also be represented by a floor plan. Land would not necessarily have imagery attached.
It was because of these anomalies we recorded the property type.
New or Established
Similarly, it was because brand new property could dominate a zip code and feature only a floor plan, we recorded whether the property was existing, or being built or sold before being built.
There is a fair amount of variance in the way a property or a block of land is advertised as a brand-new property as opposed to an existing one. If something is new, there is an inclination to rely upon blueprints, plat maps and sometimes Google Earth imagery over professional photography for example.
Separating the products gives the ability to analyse both established and new homes separately.
Error reporting
As part of the research, we had three sets of eyes over 5,000 images to give us an idea of the error rate within the categories.
Errors rates were found to be:
- 8.7 in every 1000 for property photography
- 2.4 of every 1000 for HDR
- .03 of every 1000 for floor plans
- .02 of every 1000 for Virtual Tours
Not only did we correct the 5,000 images we investigated, but we also found the error rates to be acceptable to the sample size and outcome.
Regional & Metropolitan areas
Given I can make very little claim to knowledge of rural or regional areas of the USA as a geographically-challenged Australian, we left the definitions up to the Bureau of Economic Analysis and Health Resources & Services Administration (see links below).
You will notice that the areas are sometimes divided up into metropolitan, micropolitan, and rural areas. Whilst not entirely correct, we have rephrased for a better divisional understanding of commonly used terminology:
- Metropolitan = Metropolitan
- Micropolitan = Regional
- Rural = Regional
https://www.hrsa.gov/rural-health/about-us/definition/index.html
https://www.bea.gov/help/faq/459
FINDINGS
 INTERPRETATION
Virtual Tours
Since the pandemic began, the internet has been on the verge of breaking with news about the upsurgence of the Virtual Tour.
- In March 2020, FoxBusiness declared that “Virtual Tours have become the norm”.
- Zillow CEO Rich Barton told stakeholders and media at the company’s earnings call that the “tectonic shift” and “grand reshuffling” were well underway as real estate marketing went virtual.
- NAR published findings that said 35% of realtors rely on virtual tours to sell homes.
- Forbes declared in January 2021 that for the first time in history buyers now prefer to take a Virtual Tour before viewing a home in person.
- CNBC published an article that basically credited the Virtual Tour with saving the real estate industry: “Housing market skirts crisis as sellers use 3D Virtual Tours to find eager buyers”.
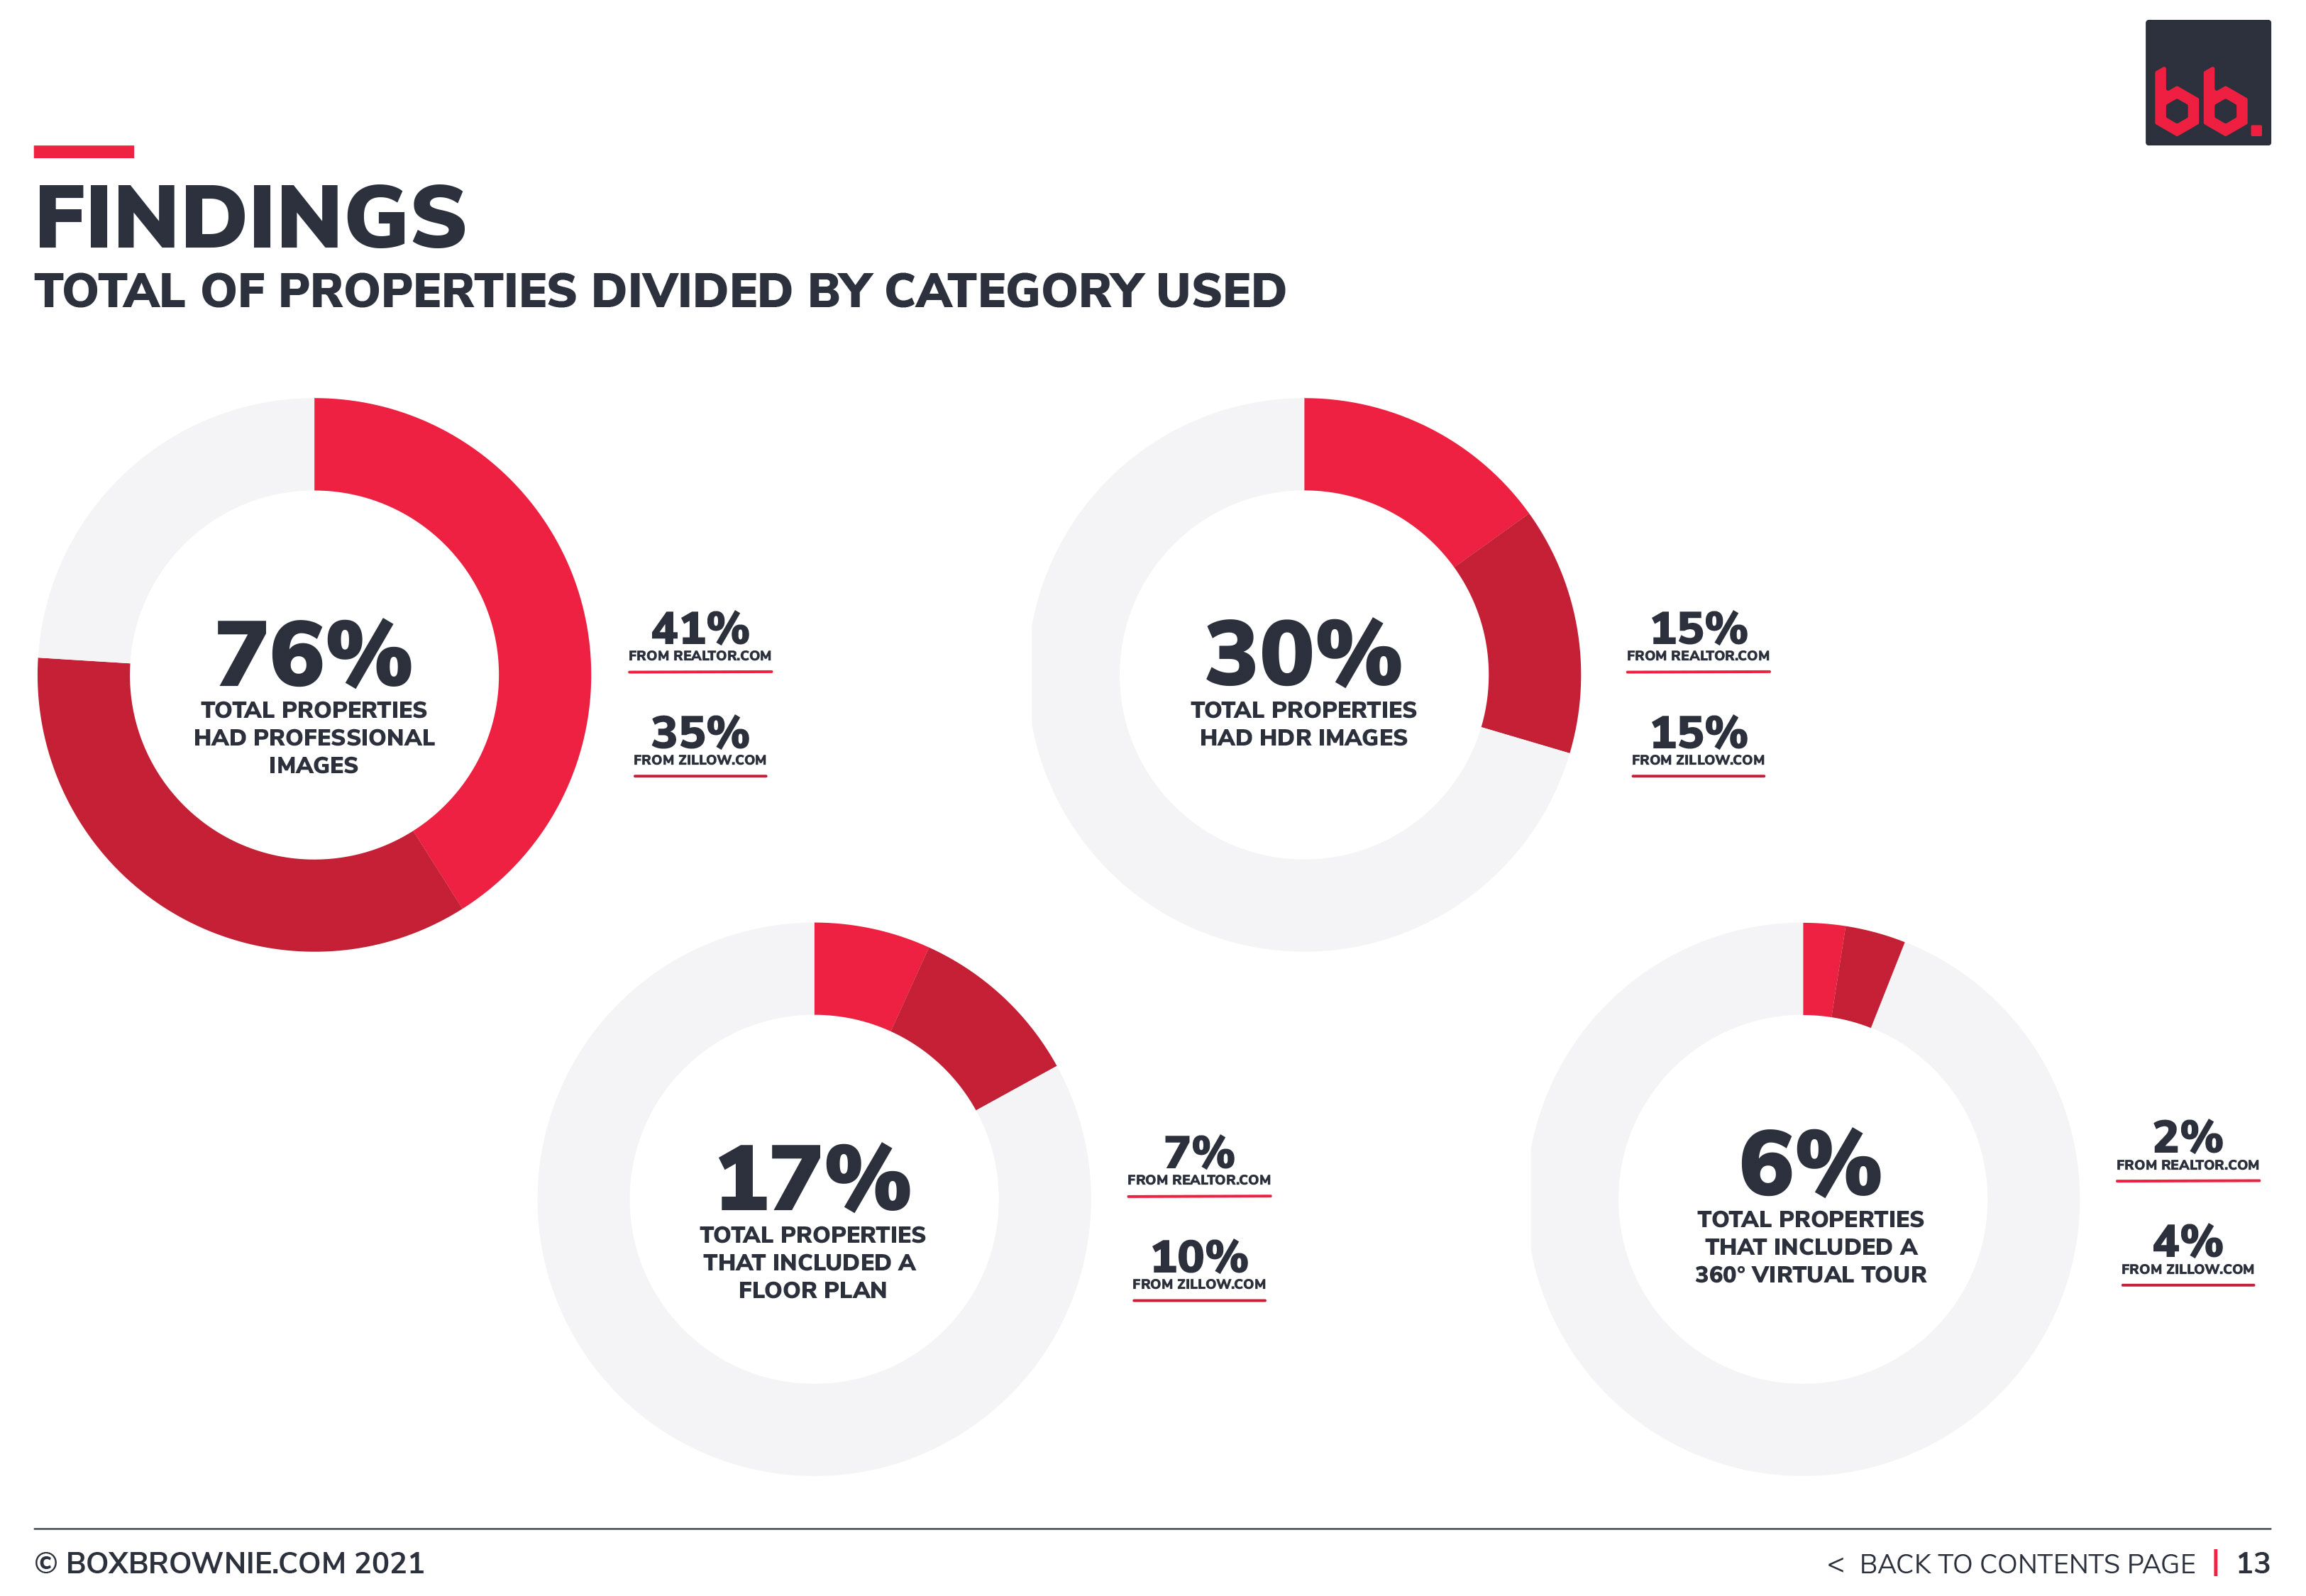
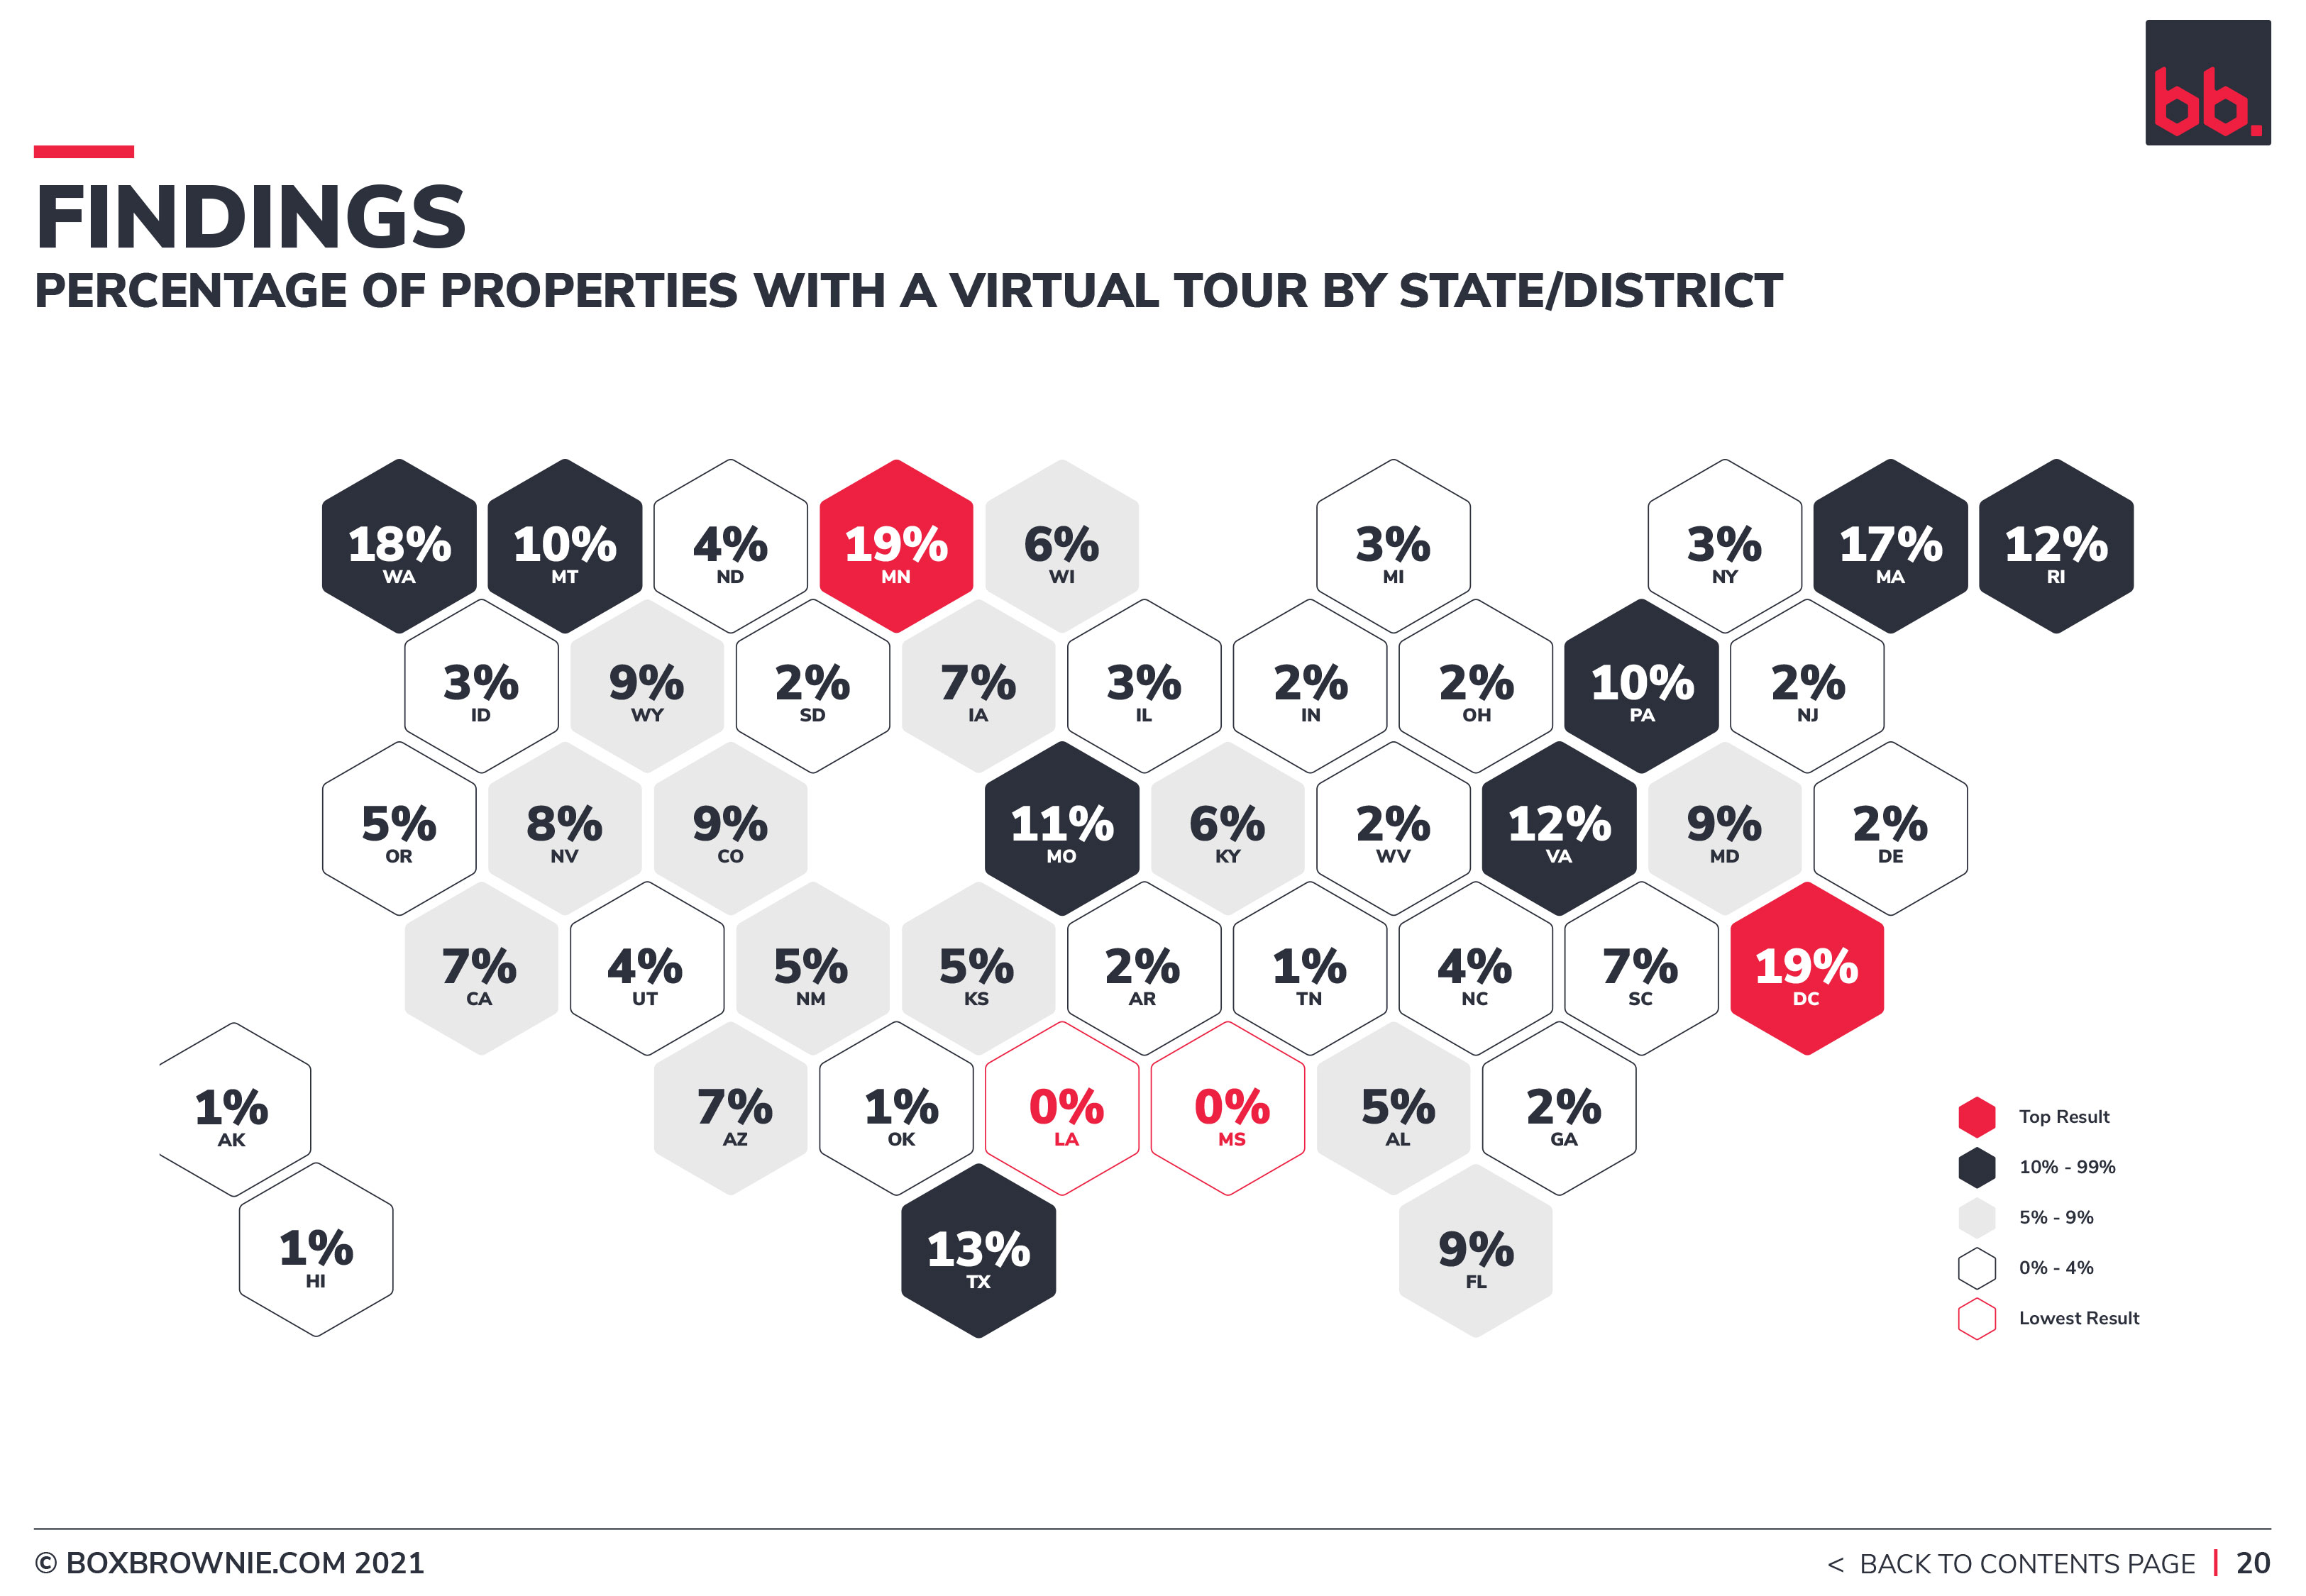
BoxBrownie.com research has found immersive tours (360°, 3D, Virtual Tours) on less than 6% of listings. The official number was 5.9%.
Given the survey size, it would be quite difficult to justify an immersive Virtual Tour statistic being anything higher than the 6% found in the survey results, given that it was a static number regardless of location (state, zip code), and even similar probability regardless of property pricing or portal the listing was displayed on.
Here are some reasons we believe the number to be inflated in other articles’ survey results:
- The sample size of a survey may be smaller.
- The area surveyed may be prone to a higher percentage being used (for example New York surveyed as opposed to Nebraska).
- Other research is simply looking at links provided within listings and assuming they are Virtual Tours rather than videos or slideshows.
The study did look at the total amount of links attached to a listing. It was found the listing had a 16.59% chance of having a link to the Virtual Tour. Even this figure fell far short of some of the claims around the marketplace today.
Anecdotally, we estimate there has been an annual 1% upwards swing toward the Virtual Tour. This is largely based on test research we ran very similarly to this research at the end of 2020. This figure is also in keeping with the BoxBrownie.com internal upward movement with regards to Virtual Tour sales.
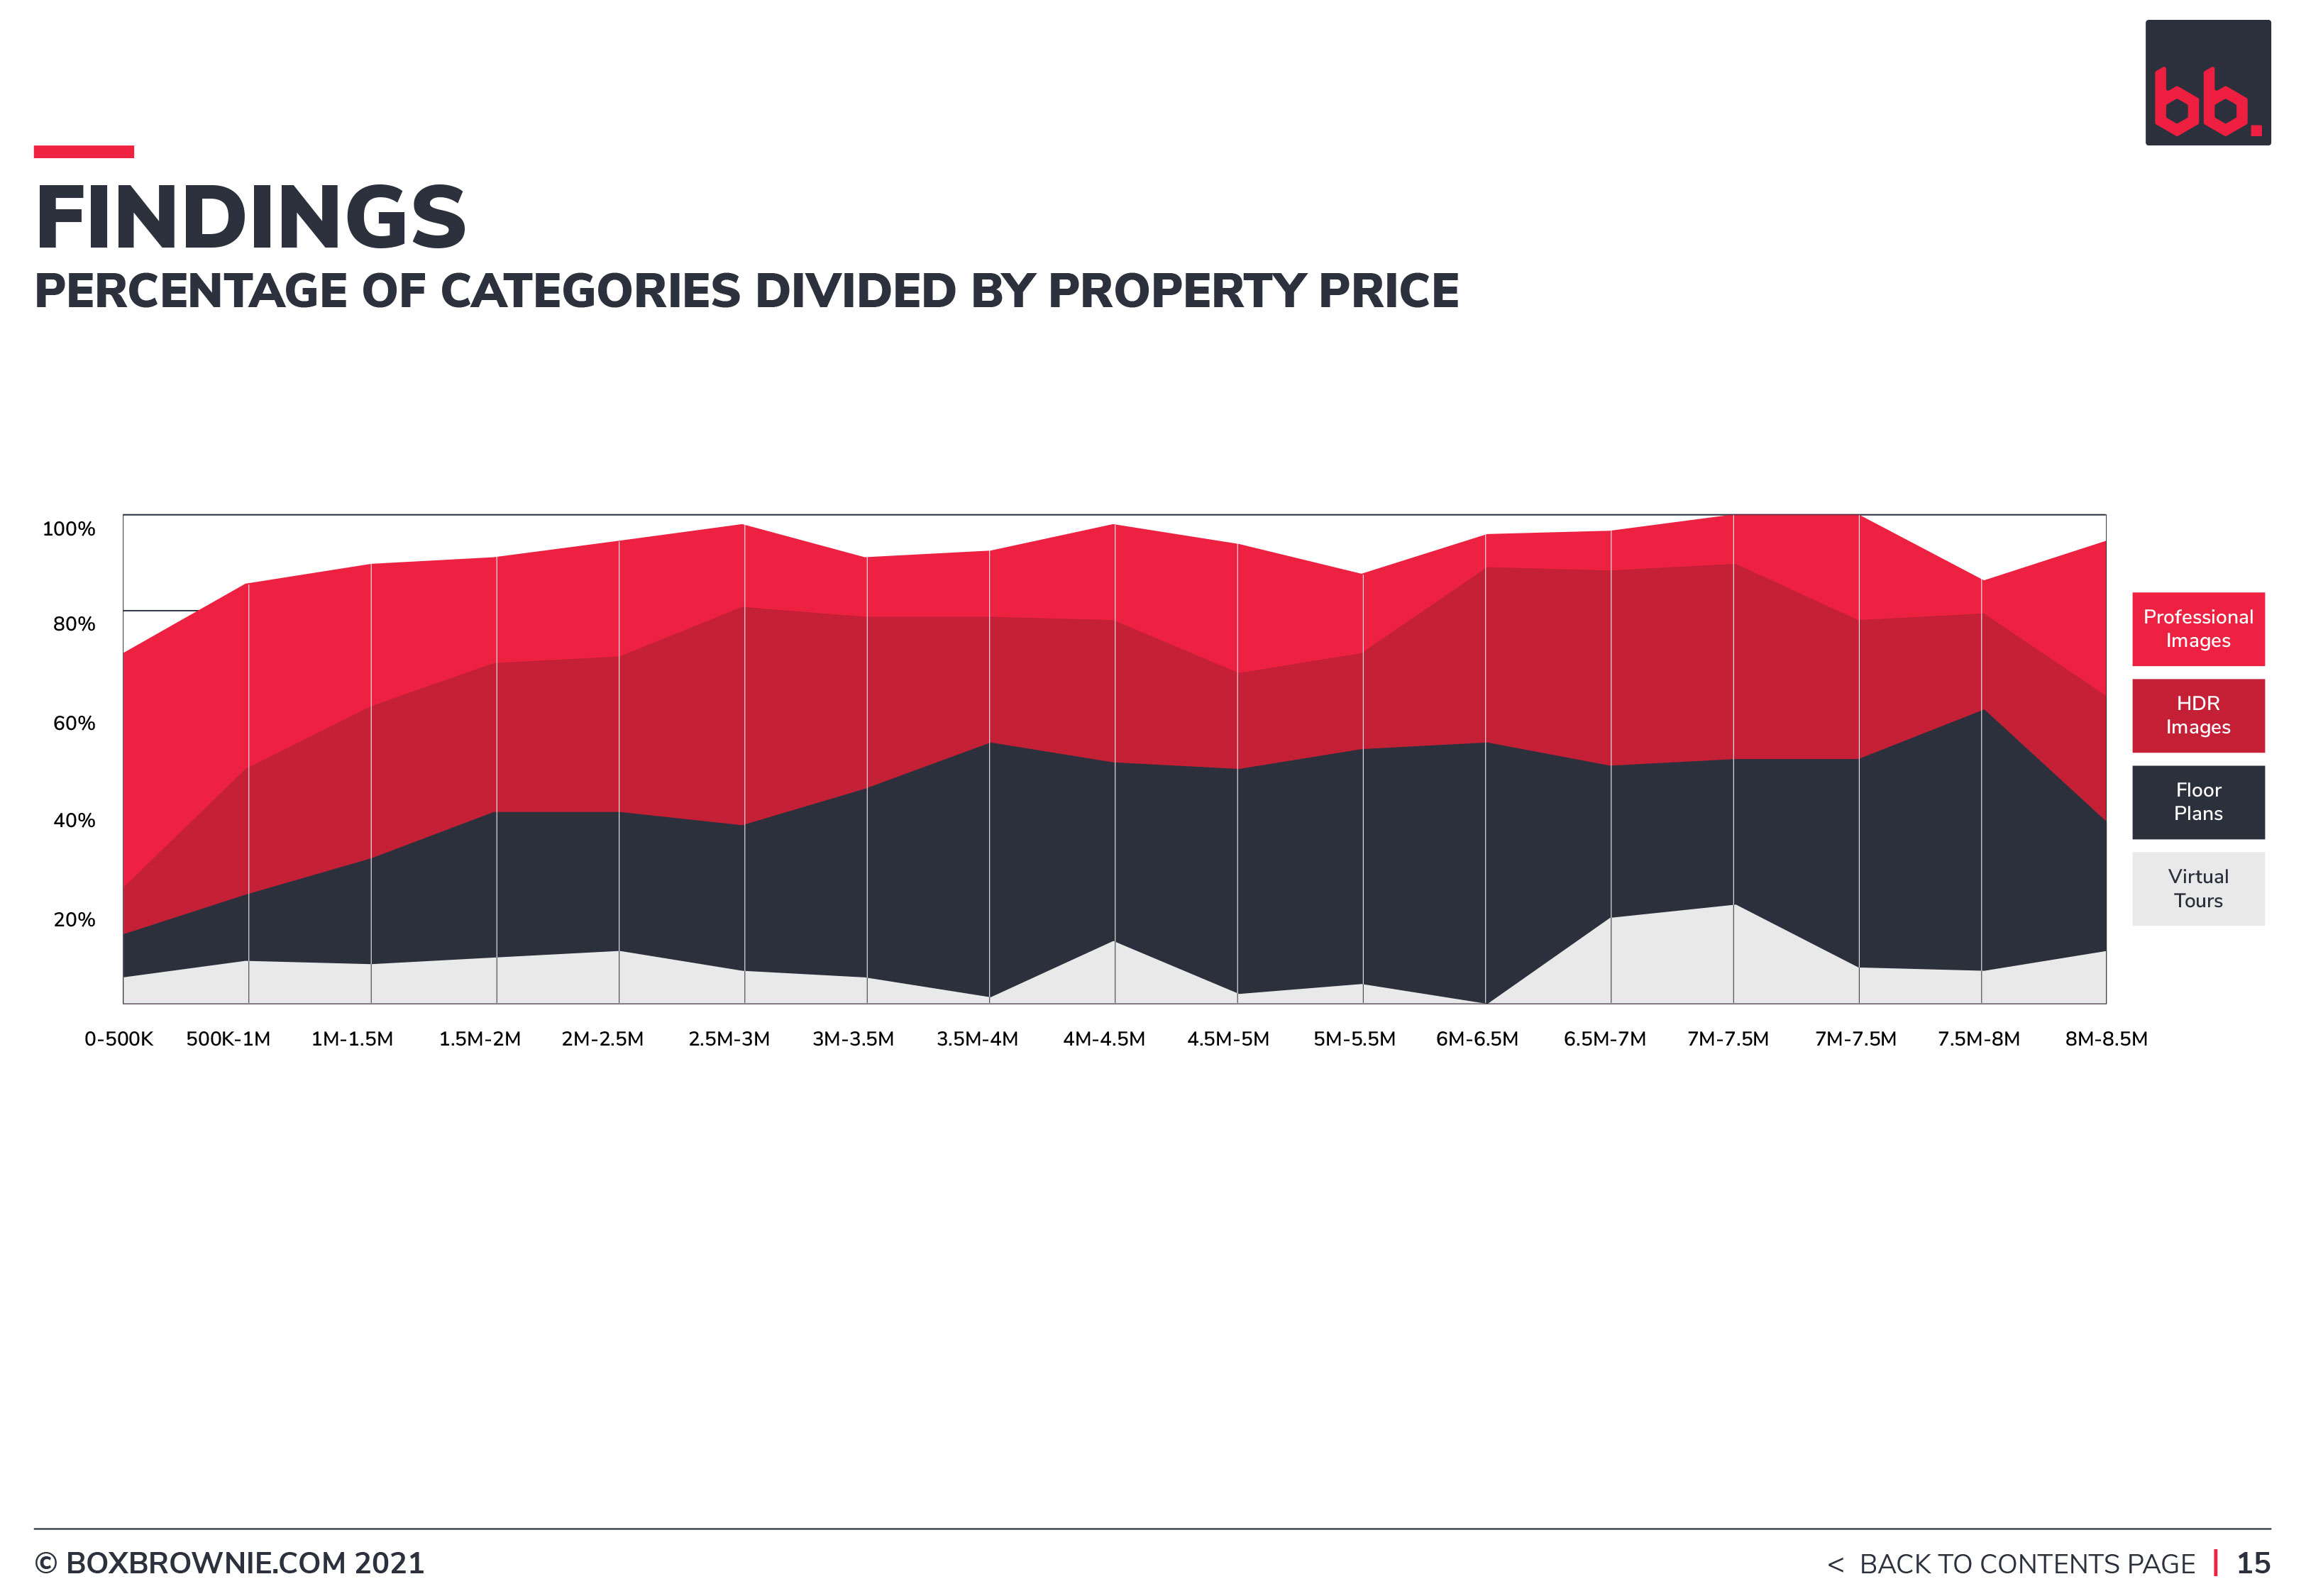
The appearance of Virtual Tours noted by property price seems to follow similar global trends in the USA. Notably, only 5% of listings under $500k were found to have one. The probability increased as high as 10% in the $2-2.5m price range. It is worth mentioning that a lot of higher-priced properties have valid reasons not to include a Virtual Tour - safe rooms and security risks being two good reasons.
The presence of Virtual Tours in higher-priced properties gives us an indication that the probability of finding one in this market is more than likely headed in an upwards direction. The overall findings are suggesting it is probably not as quick as the industry and purchasers would like to see.
Recommendations:
Virtual Tours are over 20 years old (est. 1994) and have been mainstream for at least 10 years. They are no longer difficult to shoot, cost-prohibitive, or time-intensive. Importantly, purchasers value them highly in decision-making around the purchase of a home.
It has always been the belief of BoxBrownie.com that agents should be able to provide for themselves with 360° photography. Equally, we would hope that brokers are also providing the required tools for their agents to access and use.
Professional Photography
Our survey results point to a 76% probability nationally that the agent is paying a photographer to come and take pictures of the home. This result does echo the anecdotal evidence released in our preliminary findings of the percentage of agents who believe they are delivering professional photography.
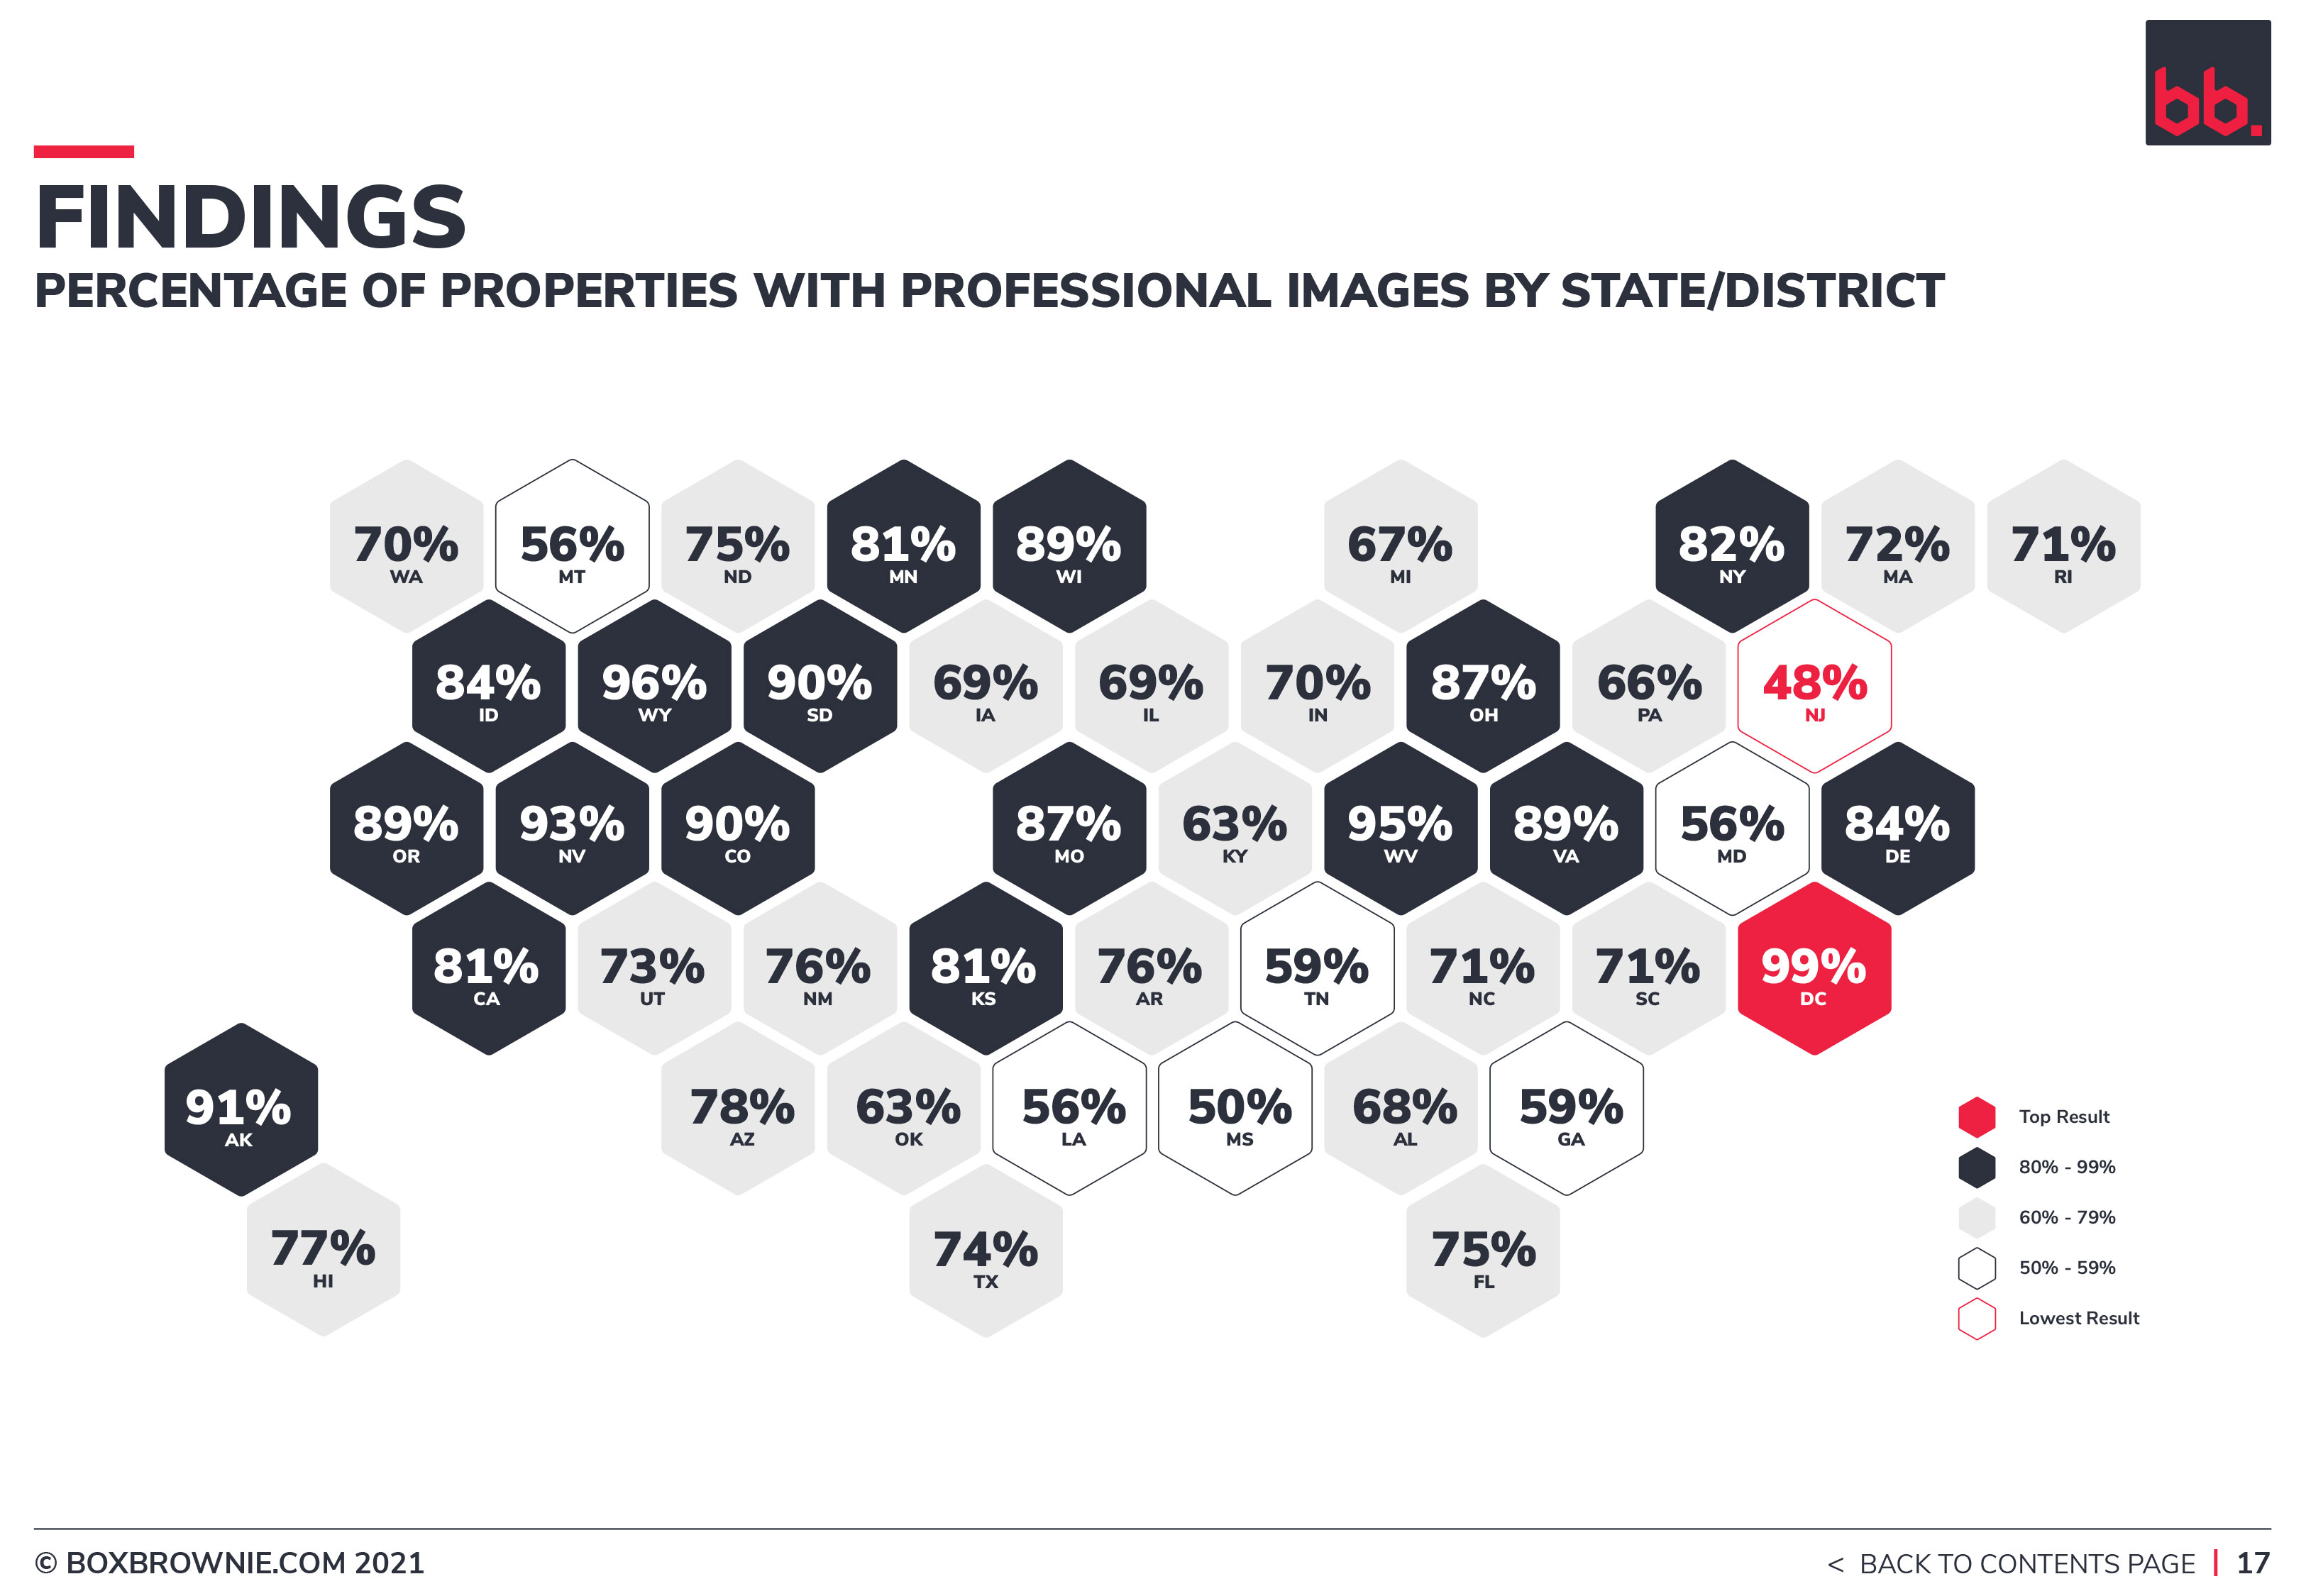
State by state, there was a substantial variance in delivery by a professional photographer, with some states dropping to around 50% (MD, GA, LA) and other areas as high as 96% (DC).
The variance could be linked to the randomly generated zip codes surveyed, and the possibility that the areas surveyed were less likely to have professional photography. If that was to be the case, we probably would have seen anomalies in some of the other categories we surveyed (like floor plans and Virtual Tours), as equally those would reflect a skewing of figures. The only way we might have been better able to prove probability better would be to double the sample size or focus on the state individually. Regardless we find the results to be conclusive.
It is true that you have a greater probability of having professional photography if you are in a more expensive neighborhood, with 71% of properties under the listing price of $500k having a professional photographer shoot them. Contrastingly, we see numbers of 85-100% for nearly all properties over that mark, up to the highest property price surveyed at $80million.
Recommendations
BoxBrownie.com has always recommended that agents use a professional photographer where possible to do so (price, time frame, availability). In line with that recommendation is the requirement that the output needs to also be professional. I will defer further comment to HDR recommendations.
We do believe educational institutions and bodies should take greater responsibility in training listing agents as to how to go about marketing a home for sale or lease. Part of that training should include sections on what constitutes professional photography.
HDR/Bracketing
Whilst the previous statistic (professional photography) paints a fairly healthy view of American property photography, the analysis of HDR/Bracketing is so far as we know the first of its kind.
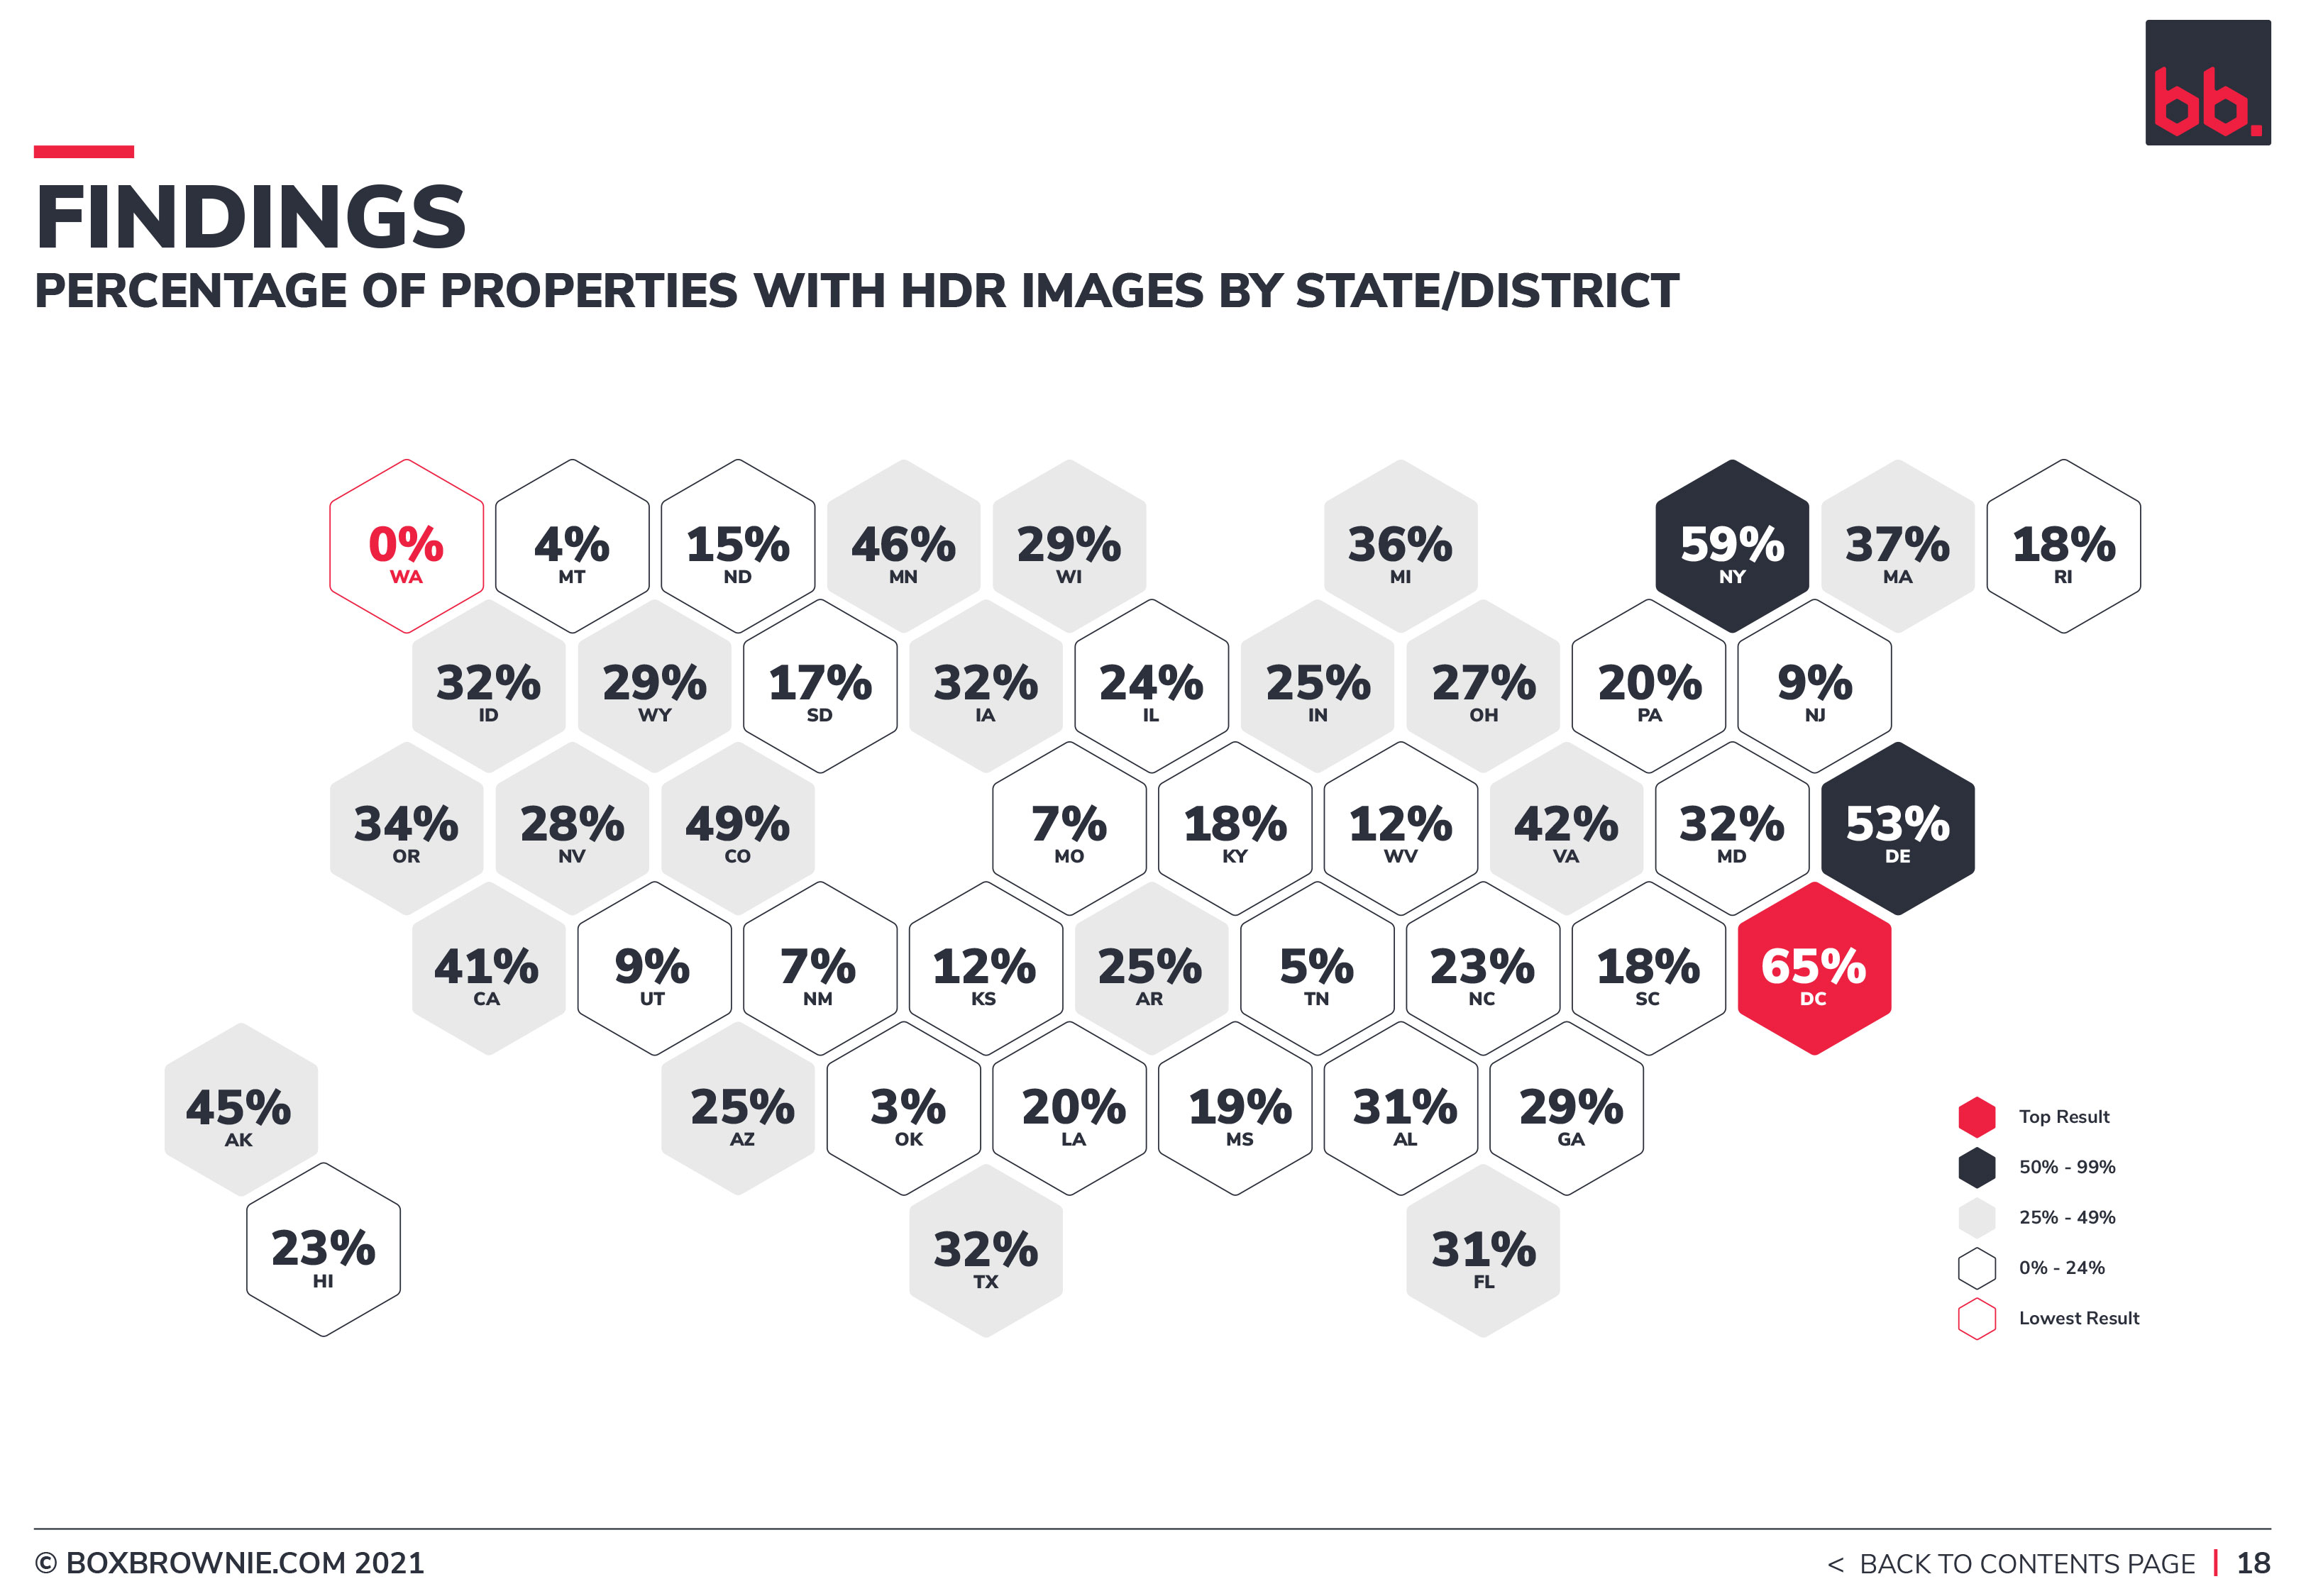
A 30% probability of a listing featuring “best practice photography” is quite low for any first-world country. And the variance across the States is very wide. From under 4% (MT) through to 65% in (DC), we could not find a discerning pattern linking usage and behaviour in this study. It would appear likely that whether a listing featured “best practice photography” was completely dependent on the photographer operating in the zip code we were surveying and how much market share that photographer held.
This technique was also very absent in homes under $500k at only 23%, rising to 48% at the $500k to $1million listing price range. Listings between $1-2mil elevated again to be between 60% and 70% of imagery shot using bracketing. Listings upward of $2mil sat between 70% and 90% of the same.
The probability of having a professional output image for your listing drops in rural areas. Only 21% of rural listings featured “best practice photography”. Overall, there was a one-in-five chance, which invariably gives the rural agents a key focus area to set themselves apart from their competition.
Floor Plans
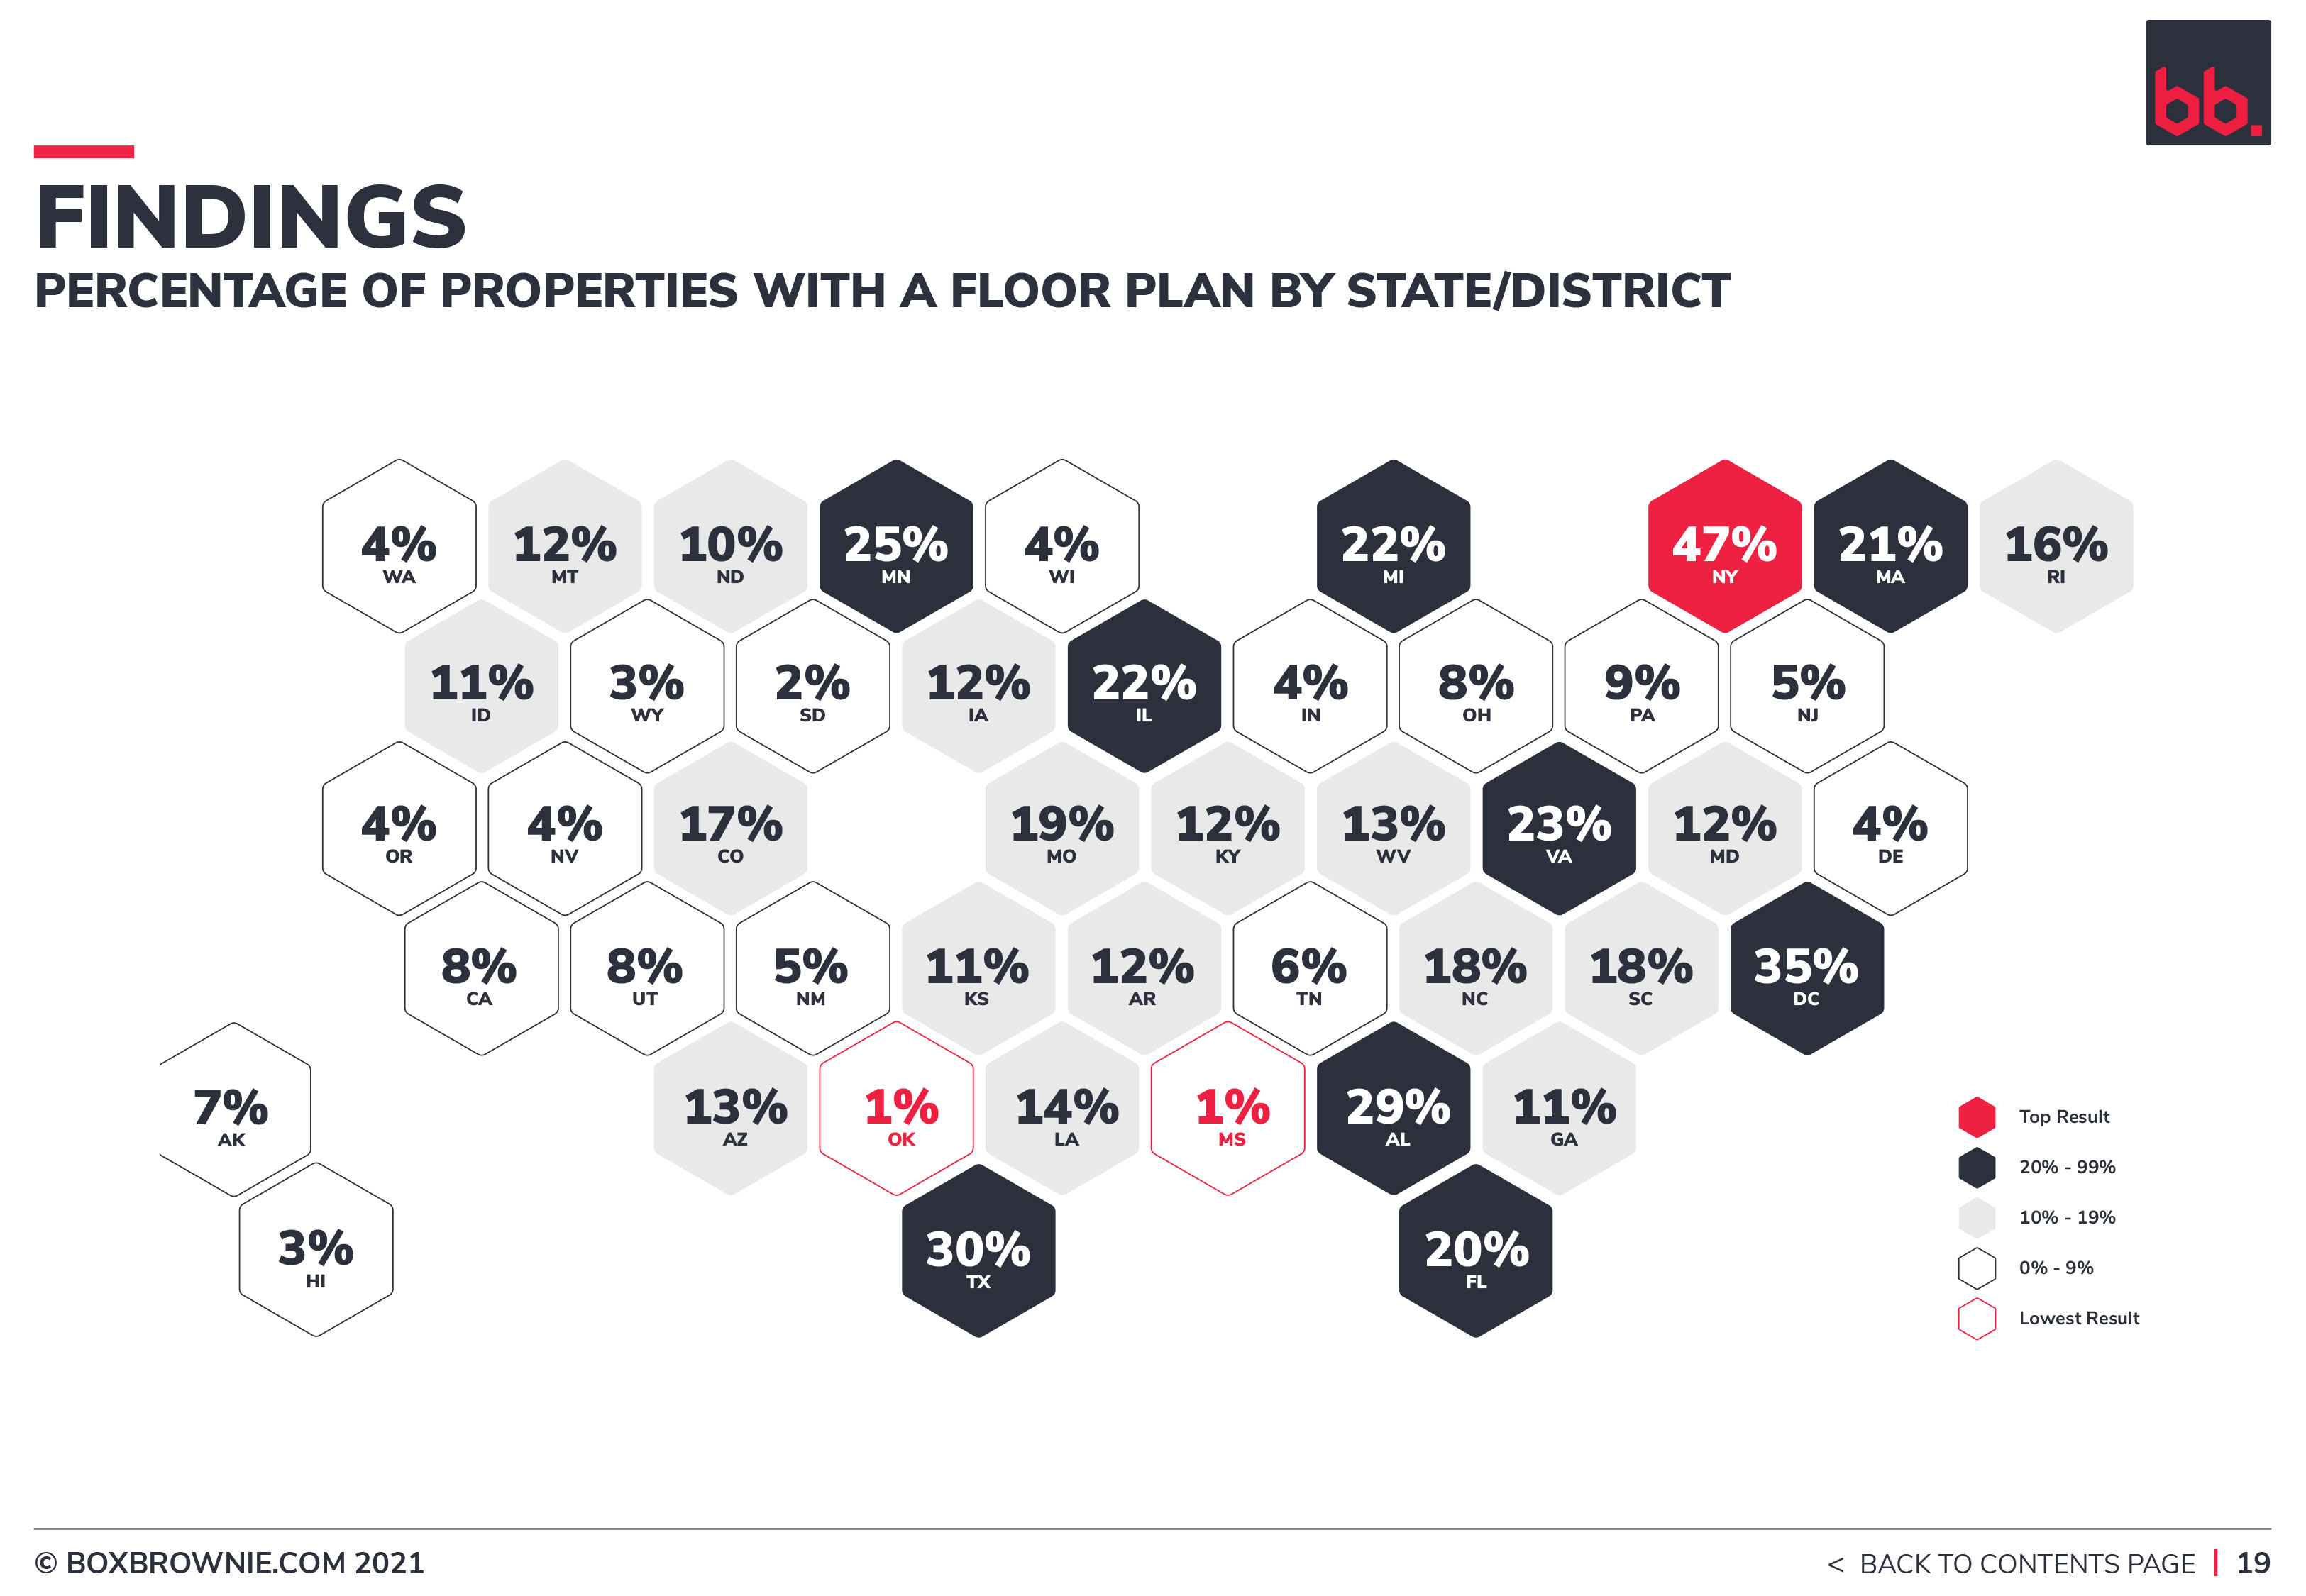
The overall usage rate of floor plans nationally is just under 17%. This statistic certainly comes as a surprise to BoxBrownie.com as we thought it would be lower based on our own (now proven) misconceptions and previous data.
Whilst it was lower when we remove the categories of multi-family dwellings and land (site plans), the number is still 10% on single-family homes. This is not a figure worth shouting from the mountain tops, but it certainly is an improvement on the previous number we had from a 2015 study which said that only 5% of MLS listings included a floor plan.
One of the reasons for the huge rise to 10% from that survey might have been because it was also the first time that a study looked at each image in a listing (floor plans can be lost at number 59 or 71 of a long line of property photos).
Recommendations
The drawing of floor plans is almost a rite of passage amongst agents in Australia. I am not sure whether it is a dying art in the USA or it never really existed, but the instances of it are low.
Floor plans for listings can be generated quite easily:
- Some sellers have existing floor plans, and an agent should be asking every vendor. I would do this before I have even set foot in the house (prior to a CMA).
- Most appraisals have floor plans attached to them as best practice and there is a good chance one was done by the appraiser when the seller originally attained finance to purchase the home.
- Home Depot offer floor plan draws in a lot of areas across the USA. When I last looked, they started from $99.
- Every agent should be able to account for themselves in this area by drawing a floor plan of a standard-sized property in about five minutes. BoxBrownie.com have blog posts teaching this exact skill.
- Sometimes a floor plan is included in a Virtual Tour.
General Comments
Market Conditions
This survey has been conducted in a particularly buoyant market for sellers, where homes are selling quite often before they hit the market. Although, as this report is released the market appears to be slowing. Across the USA, listing agents may be forgiven for cutting corners on listing marketing based upon the speed of sale. There are so many factors outside of this study coming together to form the perfect storm to make this a seller’s market. Demand, low finance rates, lack of supply, low inventory in new stock, inventory crisis’ in building and construction, and a COVID-fuelled need for an extra room, more space, or a location change have all pushed prices higher.
This will invariably mean the data is shaped to reflect the market conditions which are probably not typical of the usual visual marketing for a listing across America. I would say the survey size would stabilize the results from being too heavily swayed.
Virtual Tour Terminology Confusion
In the methodology section, we outlined our decision-making process for arriving at what we consider a “Virtual Tour” to be. It is perhaps also important to discuss the many titles given to these tours as there is apparent agent confusion as to what they are and what constitutes one.
Popular terminology includes 3D Tours, Virtual Tours, 360(°) Tours, Walk-throughs (although this can also refer to video content), Flythroughs (can also apply to CGI vision of new construction), and I am sure there are more than what I have listed above.
The truest definition for this topic would be the term 360° Photographic Tours. After all, each system is taking a 360° photograph and, in some way, organising it into a Tour.
Words like “3D” can apply to scans of rooms, but really the tour itself is not “3D” as our eyes see in 2D. Other elements like floor plans can appear as 3D in nature, or the scanning of the room, (forming part of the tour) might identify with the creation of a 3D environment.
The word “virtual” is equally ambiguous. Globally, the addition of the word “virtual” is more applicable to something that does not exist, and it would stand to follow that if the viewer is seeing it in a “virtual” way, in context they would be viewing a property that is not built yet. This is however not what the terminology is used for. It is regularly used, out of necessity within this report, for describing tours of existing homes. A great example of this anomaly is seeing things in “Virtual Reality”, or “Virtual Worlds”. Some people assume that the term “virtual” applies to the fact you are virtually there, although I do not believe this to be the reason the term exists as part of that title.
The reality of the situation is each vendor out there wants to market their property tour as something exciting and new and will generally attach buzzwords to that title.
All the above are really semantics and it doesn’t matter in the grand scheme of things. Except, the lack of a singular term is very noticeable across the Virtual Tour research results. I believe the confusion around tours terminology and definition, could potentially be the biggest stumbling block to users getting into using 360° Photographic Tours.
Preliminary discrepancies corrected in the final report
In our preliminary findings, the initial data had indicated that New York State was one of the best places to find the top marketers in the USA. I am happy to stand corrected by our team of data scientists. Our data scientists identified that our researchers had hit several veins (listing after listing) of apartments or condos in the New York area that do not exist yet. As an example, there are multiple buildings for sale with between 100-500 apartments each. Our researchers would then view 100 or more listings with the same marketing for each listing. Specifically, the same imagery (professional photography of about 6 images including HDR), the same floor plan (not a different layout), the same virtual tour of a display apartment, even the same copy. We included these apartments, but as they were all duplicates with only different apartment addresses, we reduced them to a singular listing. We also investigated every other state and found other instances of similar types of marketing, more specifically in zip codes where land was for sale. Land marketing did not as drastically affect the outcome in the way huge swathes of ghost apartment listings did. Nevertheless, we treated all states as equal and where a listing was a duplicate, we removed it.
As it stands New York State was solidly usurped by the DC area, who were in second place previously. New York State is still one of the best areas to look to for listing photography, but we found the prevalence of a Virtual Tour to fall substantially on the correction.
State Comments
Vermont, New Hampshire, Maine, Connecticut, Nebraska, were all excluded from this report simply because the random zip code generator did not generate a zipcode from any of those states.
DC
We are aware the District of Columbia is not a state or territory. We were forced to list it separately simply because both portals have it divided up as an area. Its performance across the board was outstanding, to say the least. It is difficult to compare this with other states because the DC area immediately rules out any zip codes outside of a metropolitan area, which every other state and territory were judged on.
Virginia
And, I suppose as a spillover effect, Virginia was found to be punching well above its weight with regards to all categories of visual marketing for a listing.
Washington State
Some anomalies are bound to exist. Washington State with zero per cent of HDR images is obviously not factually correct. I have searched within the State, and I can see them there. For whatever reason the zip codes we looked at had no evidence of HDR.
Others
The lower-than-expected state-wide results of New Jersey, Louisiana, and Tennessee, I found surprising. In discussions with agents from those states recently, they did not seem to think anything was out of order.
New York was still found to be leading the way in floor plans. I would attribute this fact to the prevailing dominance of multi-family dwellings, and their proclivity to include a floor plan. New York also had exceptionally high professional photography and HDR rates.
California represented well in the area of professional photography, but then went missing in action for floor plans, whilst featuring a modest smattering of virtual tours.
Florida seems content to ride the middle, not really standing out in any of the categories.
Minnesota appears to be punching well above its weight, which comes as no surprise to me. The professionalism of the agents I know in the area and the prevalence of teams who work together and share ideas make this a dynamic real estate industry area.
The Carolinas never like to refer to themselves as twinning, but there was a lot in common with their visual listing marketing.
Professional Photography
I have always found the term “professional” in front of, “photographer” to be a highly subjective term. There does not appear to be a benchmark or industry standardised delivery rate through the USA. There does not appear to be a qualification one can get acting as a tick of approval or statement of attainment. I have found every large photographic company to vary substantially from output to output and shoot to shoot.
Each agent in each area is subject to the whims of 1) what they understand a professional photographer to be, 2) industry standards of what a professional photographer looks like, and 3) the photography that they see on other agents’ listings.
I would also suggest (and have so in many media articles) that we are at the turning point for professional photographers globally, but particularly in the USA.
The part of this report that is slightly more concerning for professional photographers is the absence of the HDR/Bracketing element. There does not appear to be a valid or reasonable excuse for its absence, especially when you consider:
- The technique is not hard to do: https://www.youtube.com/watch?v=kwLXjXfZ3hE&t=1s&ab_channel=BoxBrownie.com.
- It does not take any longer and in many respects is faster.
- It should not cost the photographer any more money.
- The photography outputs are much more consistent.
- It looks absolutely better than other alternative editing styles.
- The photographic output is requested by the purchaser who genuinely wants to see outside the windows:
https://www.youtube.com/watch?v=IONfDbmENkw&ab_channel=BoxBrownie.com. - And, the photographic output better represents the seller and the home for sale.
I should also add that smartphones are now bracketing, and the results are incredible. After the purchase of a tripod, the smartphone itself, and a $7 app, each image, like the one below, is just the cost of the photo editing ($1.60). The result is faster and on-demand, meaning fresh pictures when you want them.
This image was taken on an iPhone 12 by Jesse Peters in Winnipeg Manitoba as a set of 7 brackets which were merged and edited for the above output.
The Smartphone rises, whilst the DSLR falls
Smartphones have for the past two years proven that they are an equal match for shooting directly from a high-end DSLR, and in fact most times better. This is not just our opinion; it is reflected in the constant decrease of the production of cameras. The point-and-shoot cameras are all but a thing of the past, and DSLR manufacturing has continued to slow at a rapid rate. Photography forums constantly feature surprised property photographers who have bench tested their latest smartphone against their beloved DSLR (including our own Brad Filliponi). Only to find that the smartphone image has proven to be superior or at least a comparable equal:
However, there is still a stigma attached to turning up to shoot a home (especially a luxury one) with an iPhone. Regardless, this system of photography is making huge gains on professional photography in property management and commercial agents’ markets.
Agency and Brokerage Marketing Control
One parallel we are drawing is a correlation between our own experiences dealing with brokerages and franchises in some of the areas that are indicated as being higher in the probability of better visual marketing. Let’s take NY, and DC, who have come up higher in rates of professional photography. Our experience in dealing with some of the larger brokerages in these states would indicate that not only is there quite often a marketing professional responsible for the delivery of the brokerages marketing output, but there are also minimum standards the office agents and staff are required to adhere to.
If your brokerage is of the size where this is feasible, it is a genuinely fantastic control to implement to ensure consistency of brand.
A message to the listing agent
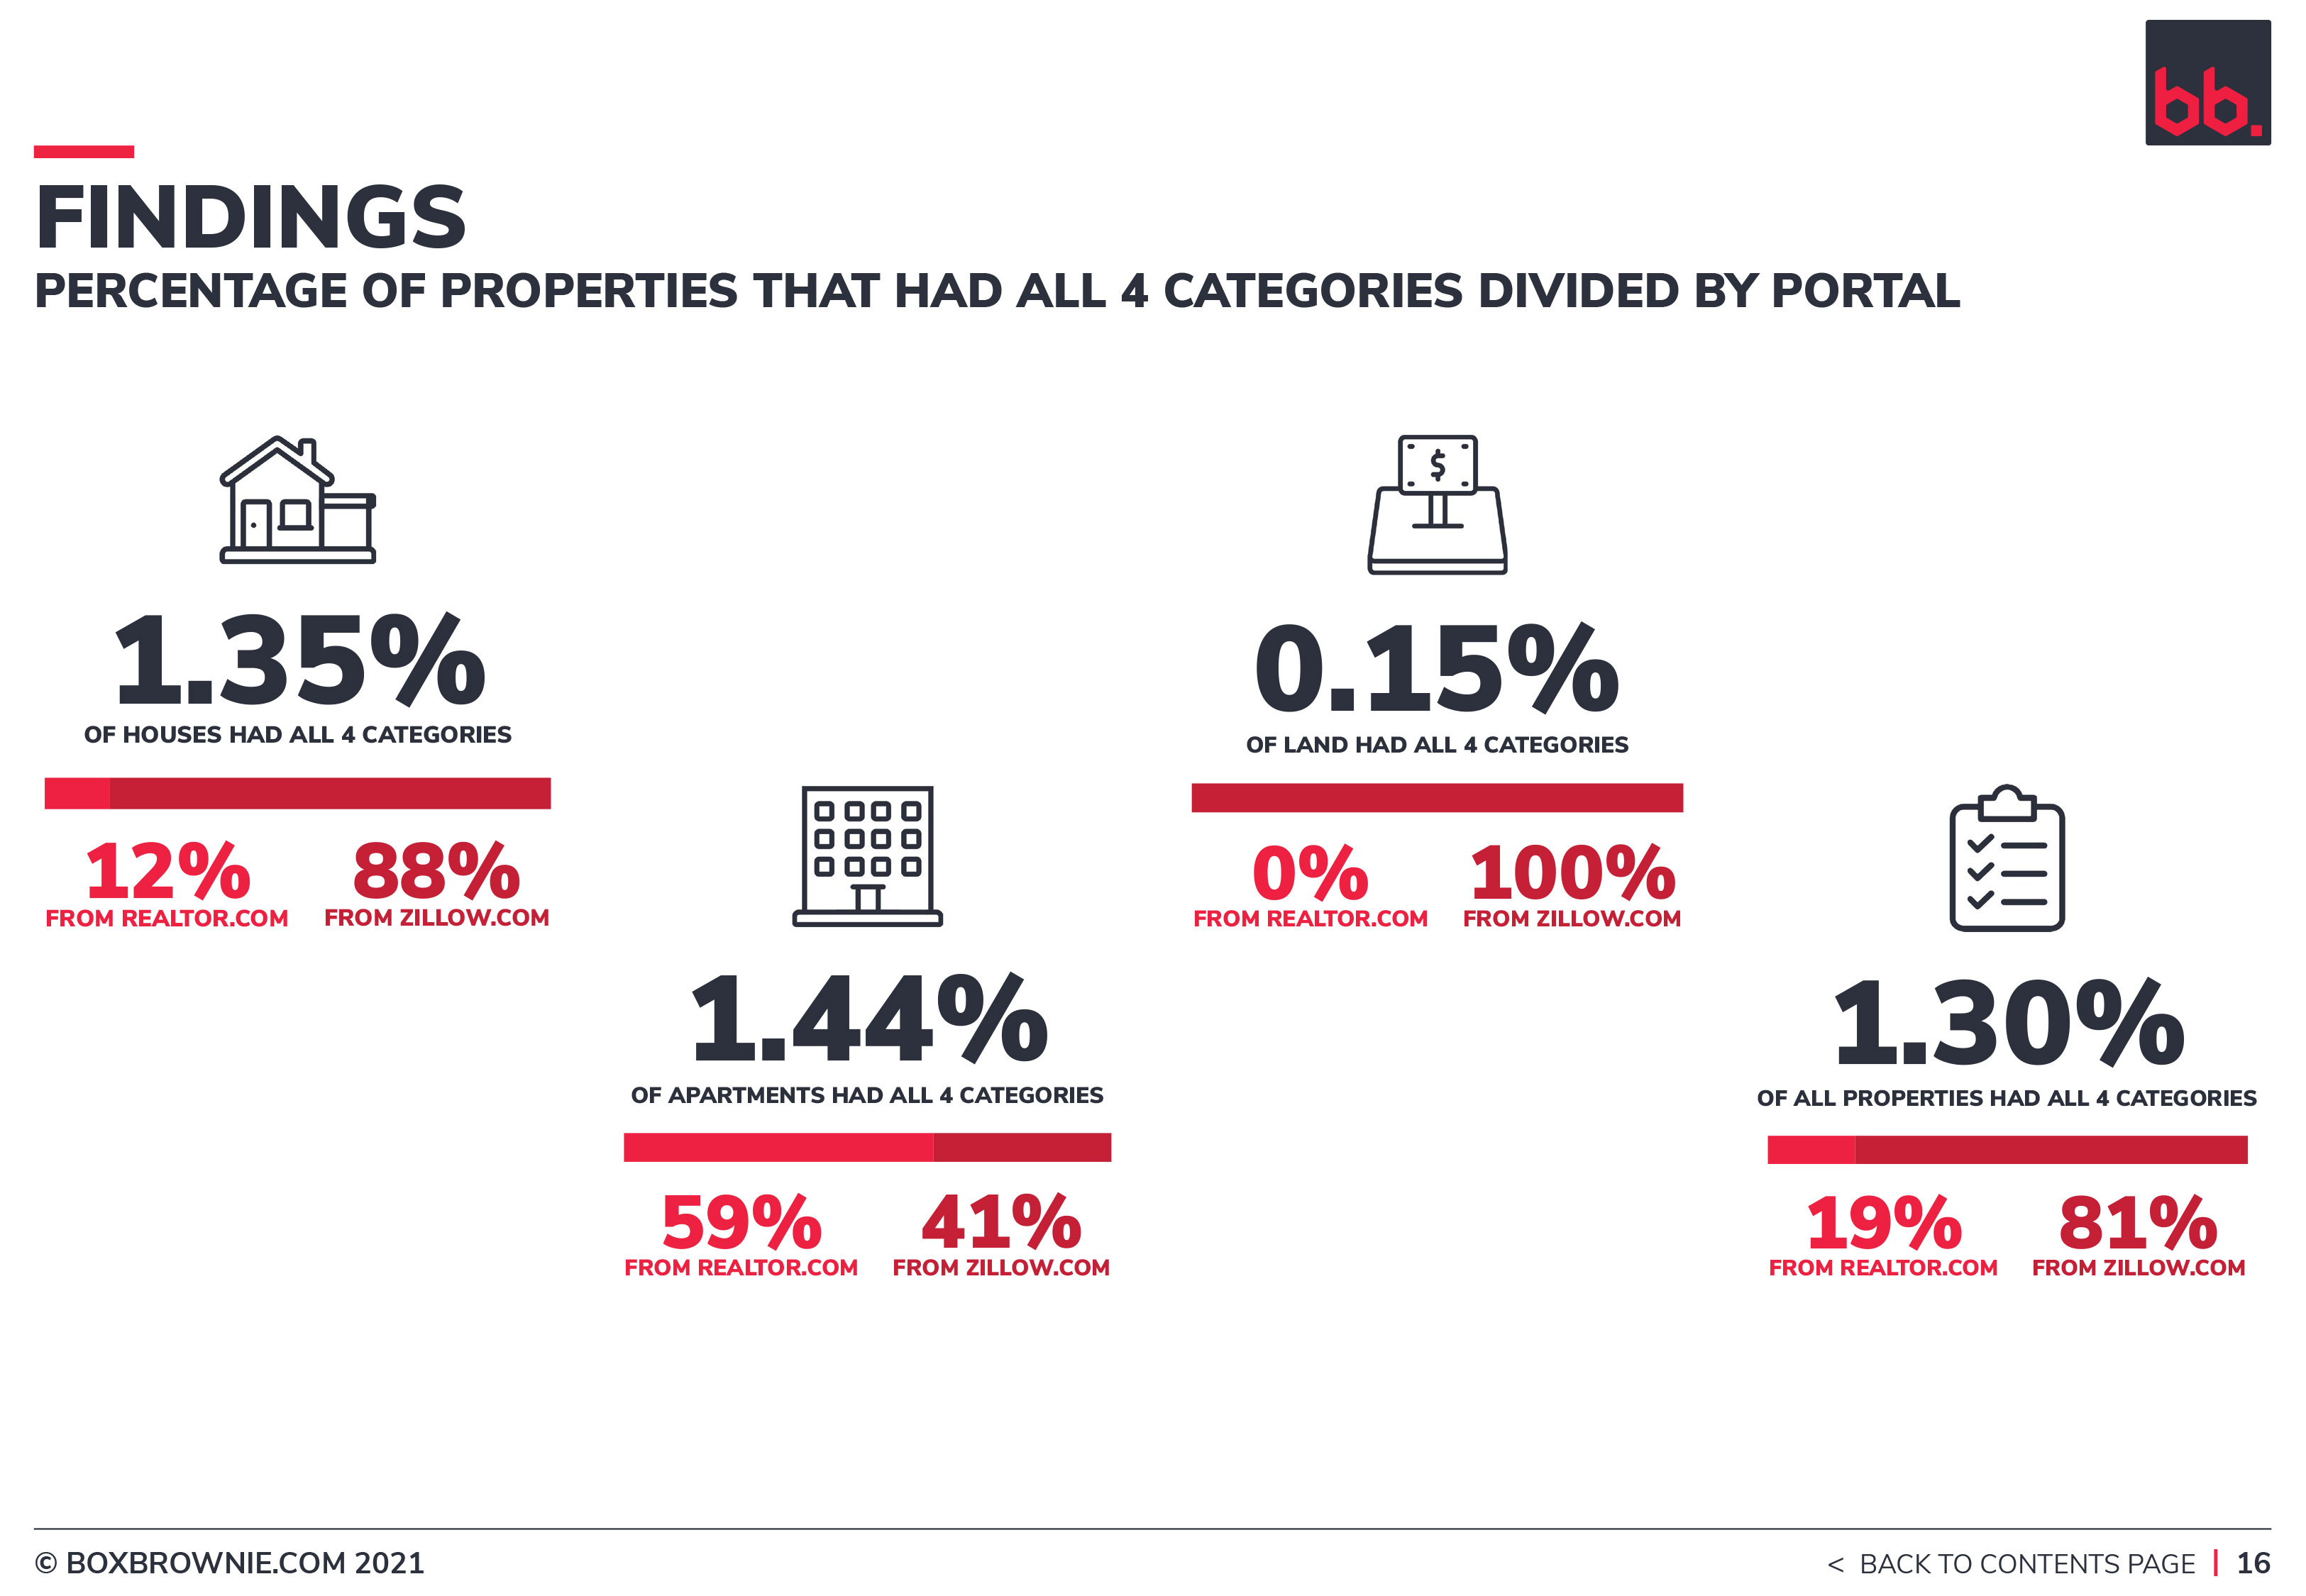
Perhaps the most uninspiring fact from this marketing pertains to our findings around listings that feature everything. Of the total 25,000 of all analysed listings, only 1.3% featured professional photography with HDR editing, a floor plan and a Virtual Tour. In other words, every single facet of our testing. Remembering that we were only looking at three things being 1) professional imagery output 2) the presence of a floor plan 3) a Virtual Tour.
There are then two ways of looking at this:
- If I were a listing agent, then I would be including these three things with every single listing as now you would be sitting inside the top half a percentile of marketing across the Nation.
- The other way is to lament the fact that listing agents are not giving a) the purchaser what they are clearly asking for b) representing the property in the best possible light.
To further extrapolate on this information, if I were looking at an industry to disrupt, I would certainly be looking at the role of a listing agent thinking I might be able to do better than what appears to be the status quo in the visual marketing for a listing.
A Message to Associations and Multiple Listing Services
It is an undeniable message in the research data, that listing agents or your members need specific assistance in marketing a property for sale. There are several ways that associations and MLSs can help.
- Organising education that specifically targets the visual marketing for the sale of a property. What this looks like involves is a multi-faceted conversation, but, not a difficult conversation, as plenty of organisations already have constructs around training for the visual marketing of a listing.
- At the point of upload. MLSs are the point of upload for the vast majority of listing photography across the USA. It would be good to discuss ideas around improving the imagery at the point of upload, as it would not just benefit the agent, but the quality of the listing on the MLS.
- The only portal in Australia is publicly owned. As a publicly listed company that portal has much higher standards of what one can and cannot put on their portal. This is backed up by education campaigns, self-help assistance, and remedial guidance on when a listing has not met the standards required.
Whilst I am not suggesting a re-invention of the wheel to take place or even that the portal in Australia has the answers (it doesn’t), the ownership the owners of that portal took in the early days certainly improved the overall standing of marketing on display. Even if this is just a department for the betterment of your listing service. And for those about to suggest they have one, I am not referring to a compliance department.
Global Standards
In our opinion, industry leaders in property marketing are the Scandinavian regions of Northern Europe and Australia/New Zealand. Even at a broad glance, this is instantly recognised if you were to quickly visit www.realestate.com.au
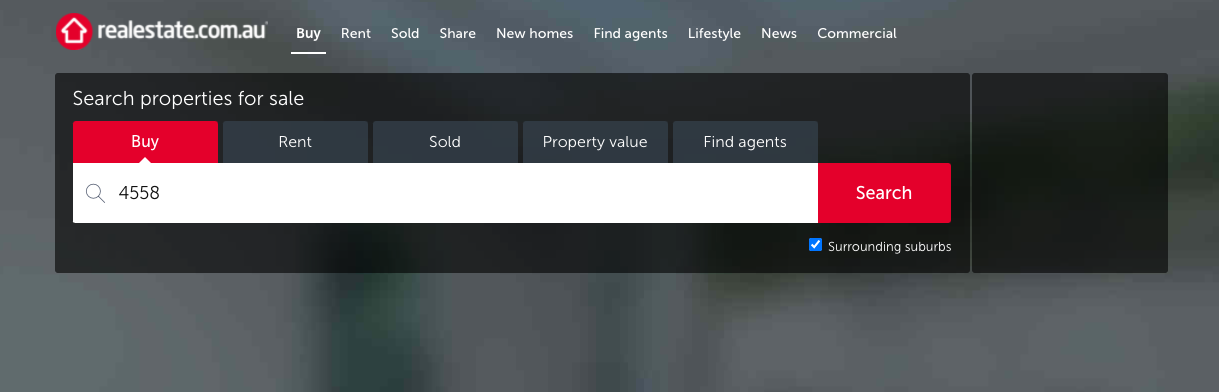 4558 is the postcode of the headquarters of BoxBrownie.com. It is by no means a wealthy person’s country club, nor lower socio-economic “hood”. But more of a working man’s coastal suburb called Maroochydore (meaning the place of the black swan). Enter that into your search engine.
If you simply browse the listings looking for the prevalence of professional (HDR) photography, floor plans, Virtual Tours and video, there is no doubt you will be amazed by not only the quality and consistency you see, but also what is not there. It will be a lot harder for you to find any poor pictures, with the output photography levels very high.
Equally, Scandinavia is another step up, with the trained eye sometimes identifying 8-10 different styles in photographic production alone, and attention to detail with newer technology like virtual staging and again a similar listing quality and consistency across the board.
How does America Compare Globally?
This is our first research survey. It will not be our last with Canadian research well and truly in the pipeline for release in our third-fourth quarter.
Without hard and fast evidence, my belief is that overall America would represent slightly behind Thailand’s visual listing marketing. To do a quick bench-test on that theory, you can visit https://www.dotproperty.co.th/ and browse the homes for sale. Generally speaking, the photography is of a higher standard, there are fewer Virtual Tours, but about the same amount of floor plans when we look at smaller survey sizes.
Metropolitan Versus Regional Areas
Having hailed from the thriving regional hub of Rockhampton in Queensland, Australia, it was about 20 years ago I realised that all visual marketing for a listing was not equal. As a green property agent at conferences in a country not known for the sharing of good ideas, it didn’t take long before I was comparing how I went about visual marketing for a listing with my Metropolitan contemporaries. There were many differences immediately, and whilst most of them were subject to the time (e.g., camera with film issues, a lack of digital presence, and paper-based advertising), I still believe Metropolitan areas are better at marketing a property for sale than their regional cousins.
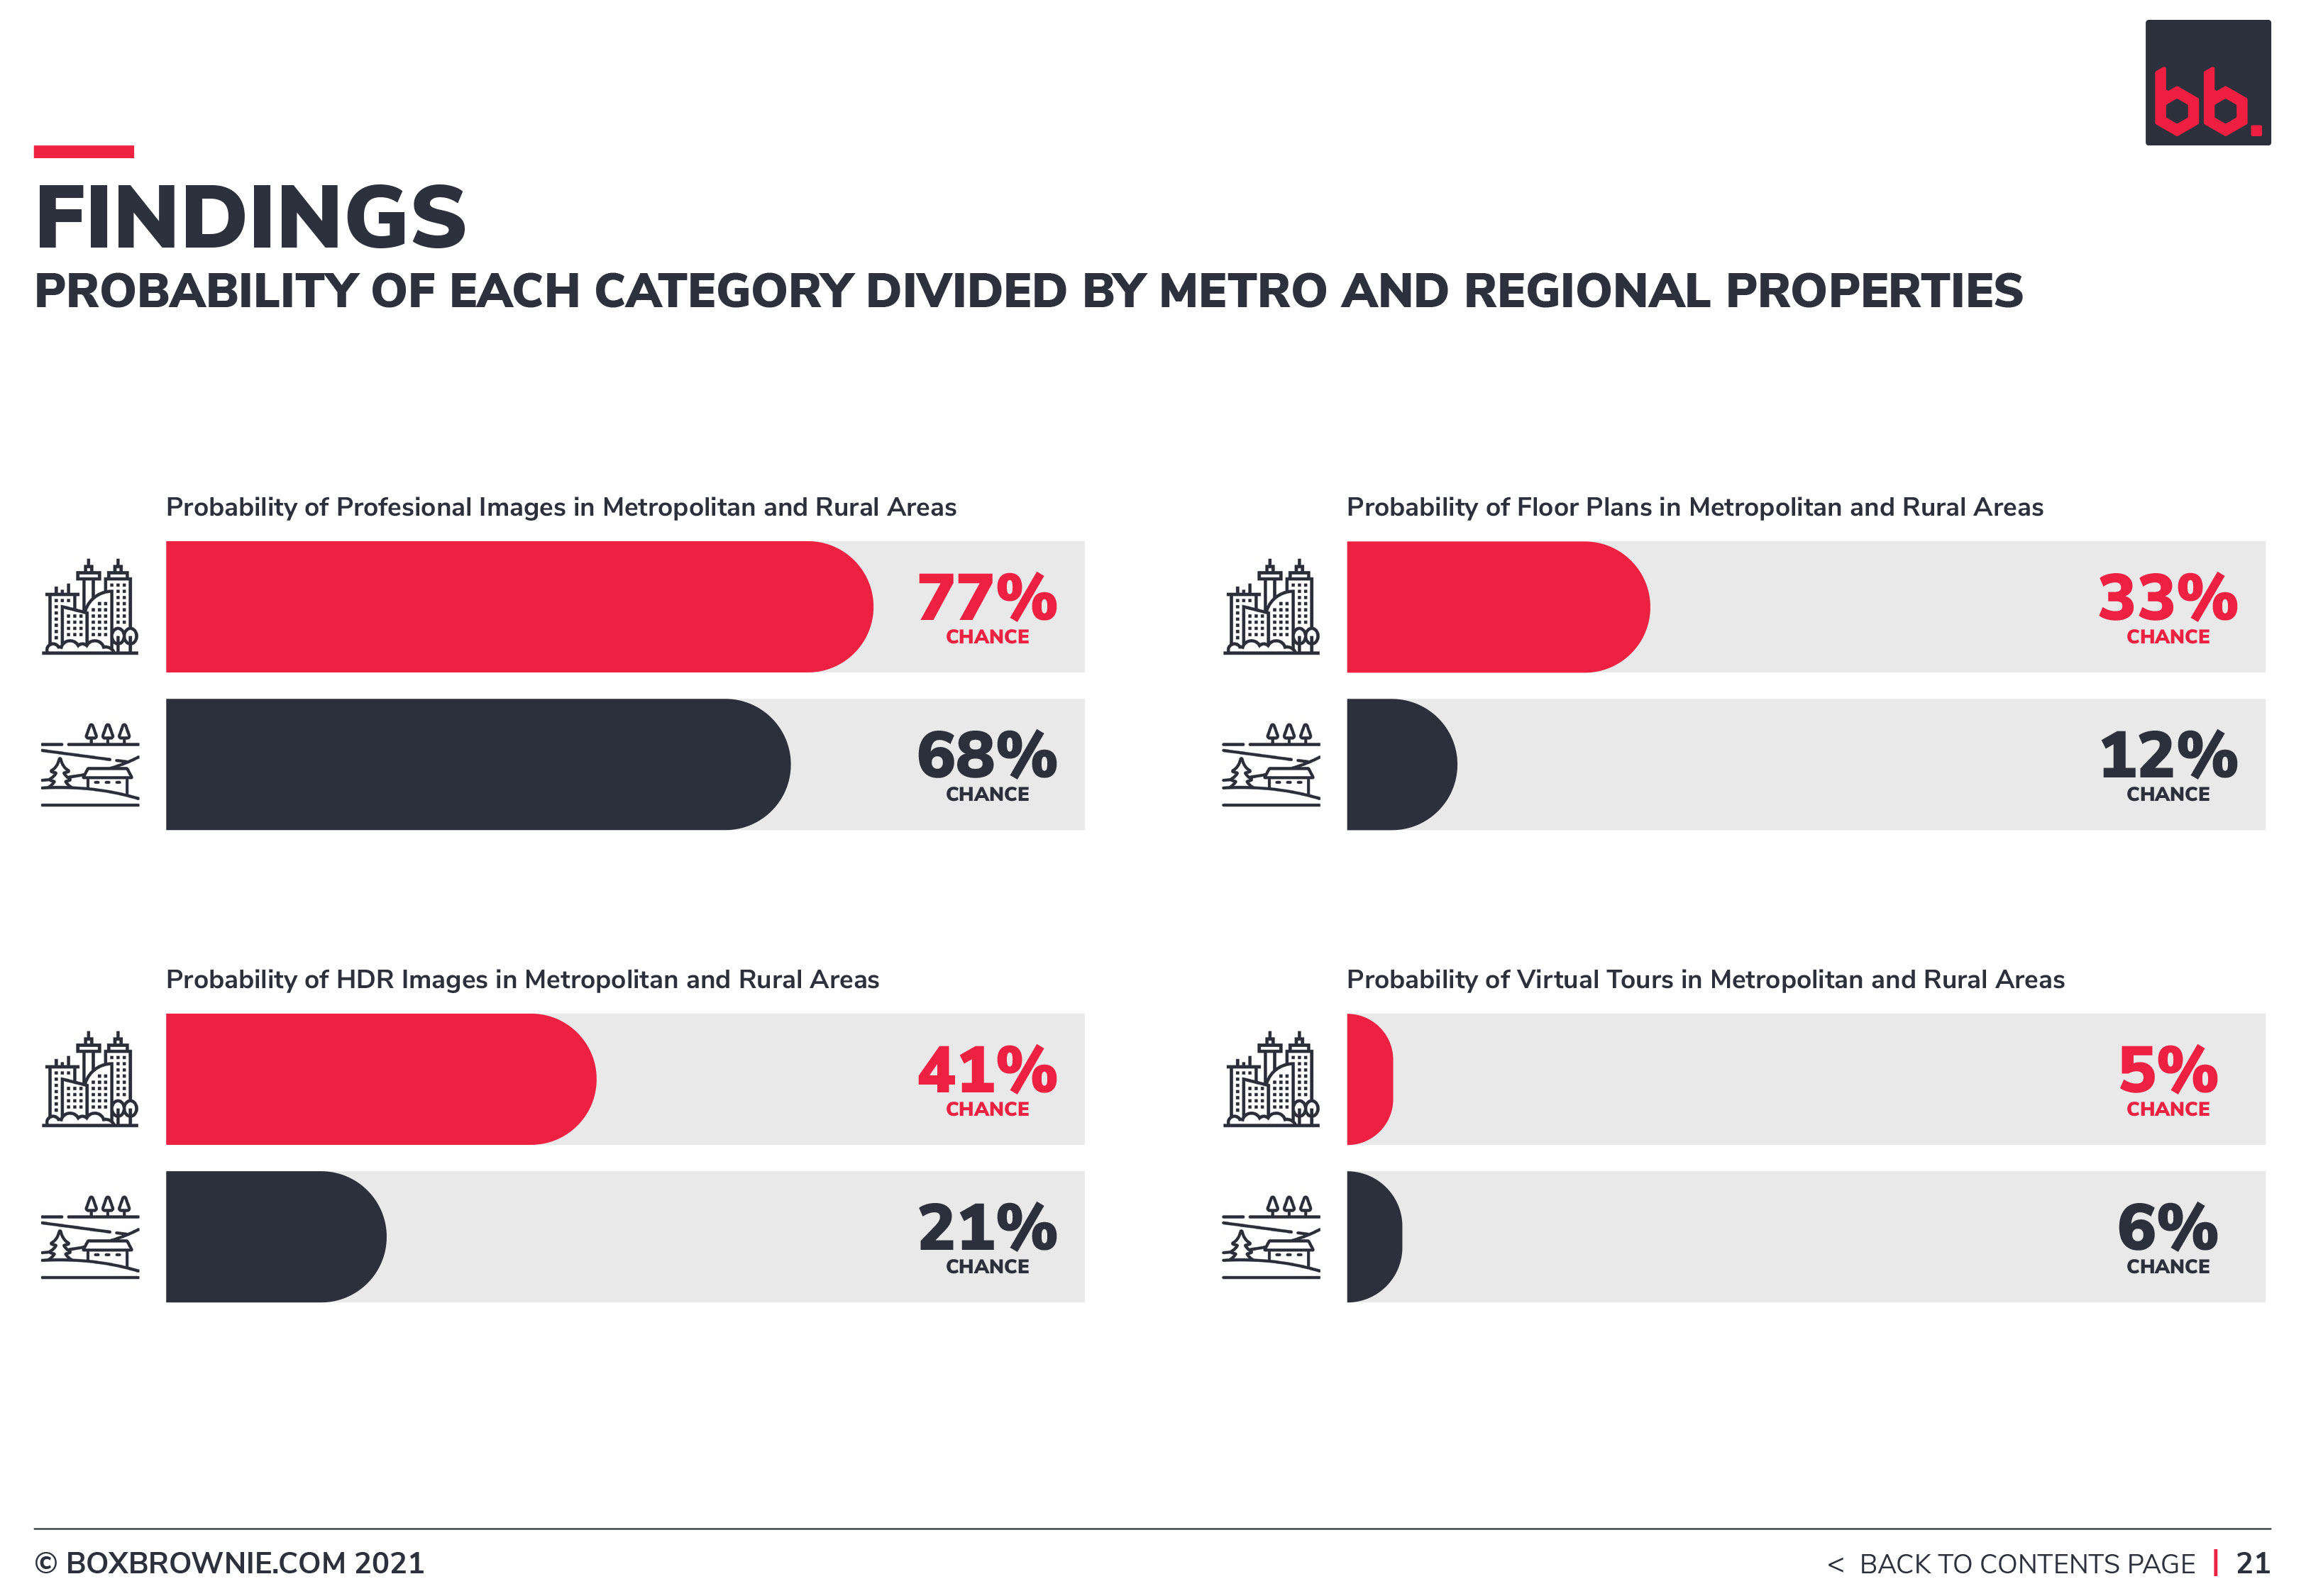
As it turns out, the data in the USA backs up my claim starting with a slightly less chance of the regional agent hiring a professional (R 68% vs M 77%). As far as similarities are concerned, we find immersive Virtual Tours to be fairly close in probability with R at 5.7% versus M at 5.3%. There is not much to read into here, but I would anticipate some more rural properties may benefit from Virtual Tours in instances where access or travel time is somehow prohibitive.
The real differentiators were found in the probabilities of floor plans (R 12% vs M 33%) and HDR (R 21% vs M 41%).
Most of these trends are reflective of marketing gaps in other countries, but there can be some suggested reasons as to why regional areas come in lower:
- Real estate photographers are harder to come by and fewer in regional areas meaning less competition.
- Unless regional agents are traveling, they may not be immersing themselves in new technology or ideas.
- If overall your standard is lower, there is less impetus for any agent to force themselves to deliver at a higher standard.
Commissioned by BoxBrownie.com
About the Author
Peter Schravemade
The report was written, and overseen by Peter Schravemade who holds the position of the Global Director of Sales Marketing and Revenue at BoxBrownie.com.
Peter is globally recognised as being the fore-most knowledge of visual listing marketing as it applies to property and building construction.
Brining over twenty years of property industry experience in the area of technology, compliance, and digital marketing, Peter mixes those elements with a more modern wealth of experience in international property markets to form opinions, provide advice, and give best practice guidance on deliverables.
Through his on-going research at BoxBrownie.com Peter continues to create and shape the landscape of visual marketing for listings using data driven insights and by collaborating with industry insiders.
Peter has in excess of fifteen years’ experience as an international speaker in a variety of capacities.
Peter is available for comment by contacting BoxBrownie.com directly or emailing [email protected].

Original Portal Data
To view the original portal data BoxBrownie.com analysed visit bit.ly/BoxBrownieOPD
RELATED ARTICLES

Selling an empty property can be stressful... but it doesn't have to be! In this video, we speak to Jodie Hedley-Ward, a top-performing agent in Australia, who reveals her odd trick to selling empty listings faster.
READ MORE
Prepare to sell your home! Literally. If you don’t properly prepare your home for that crucial day when the real estate photographer shows up, you could be short changing yourself when it comes to the sale price of your home or time on the market.
READ MORE
Looking for more real estate leads? If you’re not using Facebook to find them, you should be. Follow our lead in this post, and you’ll be one happy real estate agent!
READ MORE
Ready to make your bathroom dazzle in real estate photos? Don't overlook the importance of prepping it for the spotlight! Discover the seven tips to turning it into a showstopper that shines in listings.
READ MORE
Want to make any property look bigger and more appealing? Check out this blog for seven super simple photography tips to instantly transform your space. Learn how to capture stunning photos that will attract more buyers or renters!
READ MORE
Want to know the winning formula for selling off-plan? If you’re selling an unbuilt home and looking for a cost-effective option, we have the ultimate solution. We have two eye-catching edits that you can use to capture buyers’ hearts and imaginations. Find out how you can make maximum impact at minimal cost.
READ MORE